


SAND Technical Analysis – December 2021
Monthly Analysis
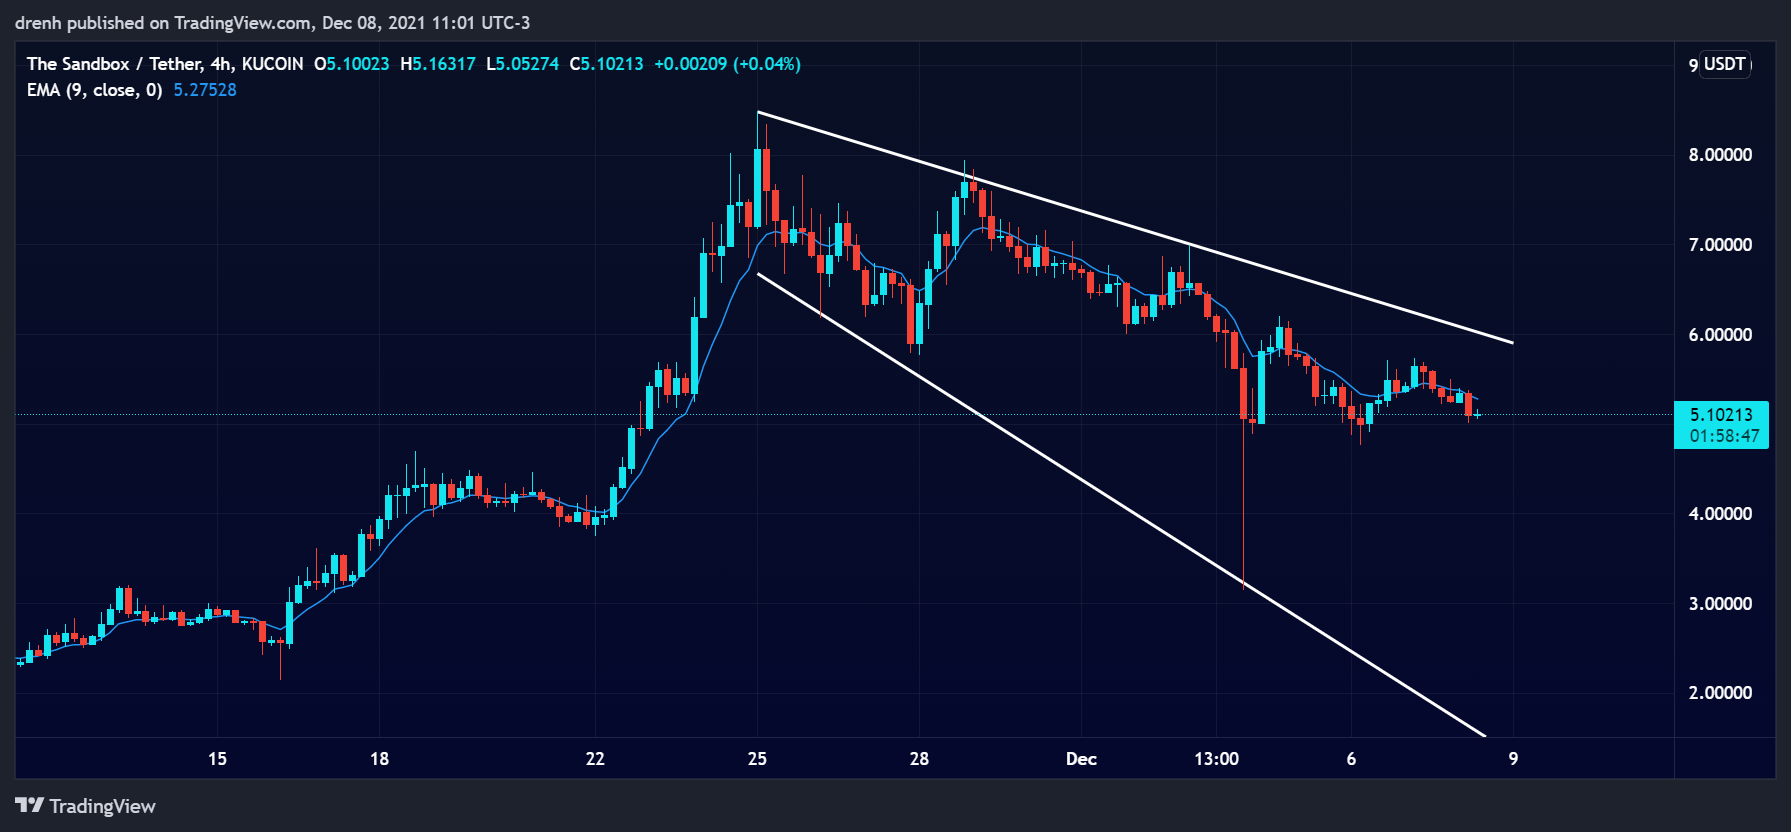
In the last 30 days, SAND was initially bullish. The price increased by more than 300%. After facing resistance at $8.47, the price started declining. New highs and lows were lower than the previous ones, indicating that the downtrend began. The price has declined by more than 60% after that.

Weekly Analysis
In the last 7 days, SAND was bearish. The price declined by 55%, even though it found support at $3.17. The price could keep declining in the coming days as the downtrend continues for SAND.
Daily Analysis
In the intraday chart, SAND has been bearish. The price has been highly volatile, and it declined by around 9% in the last few hours. It has started to find support recently, suggesting that the price may attempt an impulse upward in the short run.
Key Structures
Support
- $4.75
Resistance
- $6.24
Indicators
Moving Average
The 20-moving average of a 4-hour chart is currently above the price, indicating that the price of SAND could keep declining in the coming days.
The 9-EMA is also above the price, suggesting that SAND is bearish in the short run. The EMA line could act as potential resistance to the price of SAND if the latter attempts an impulse upwards.
Relative Strength Index
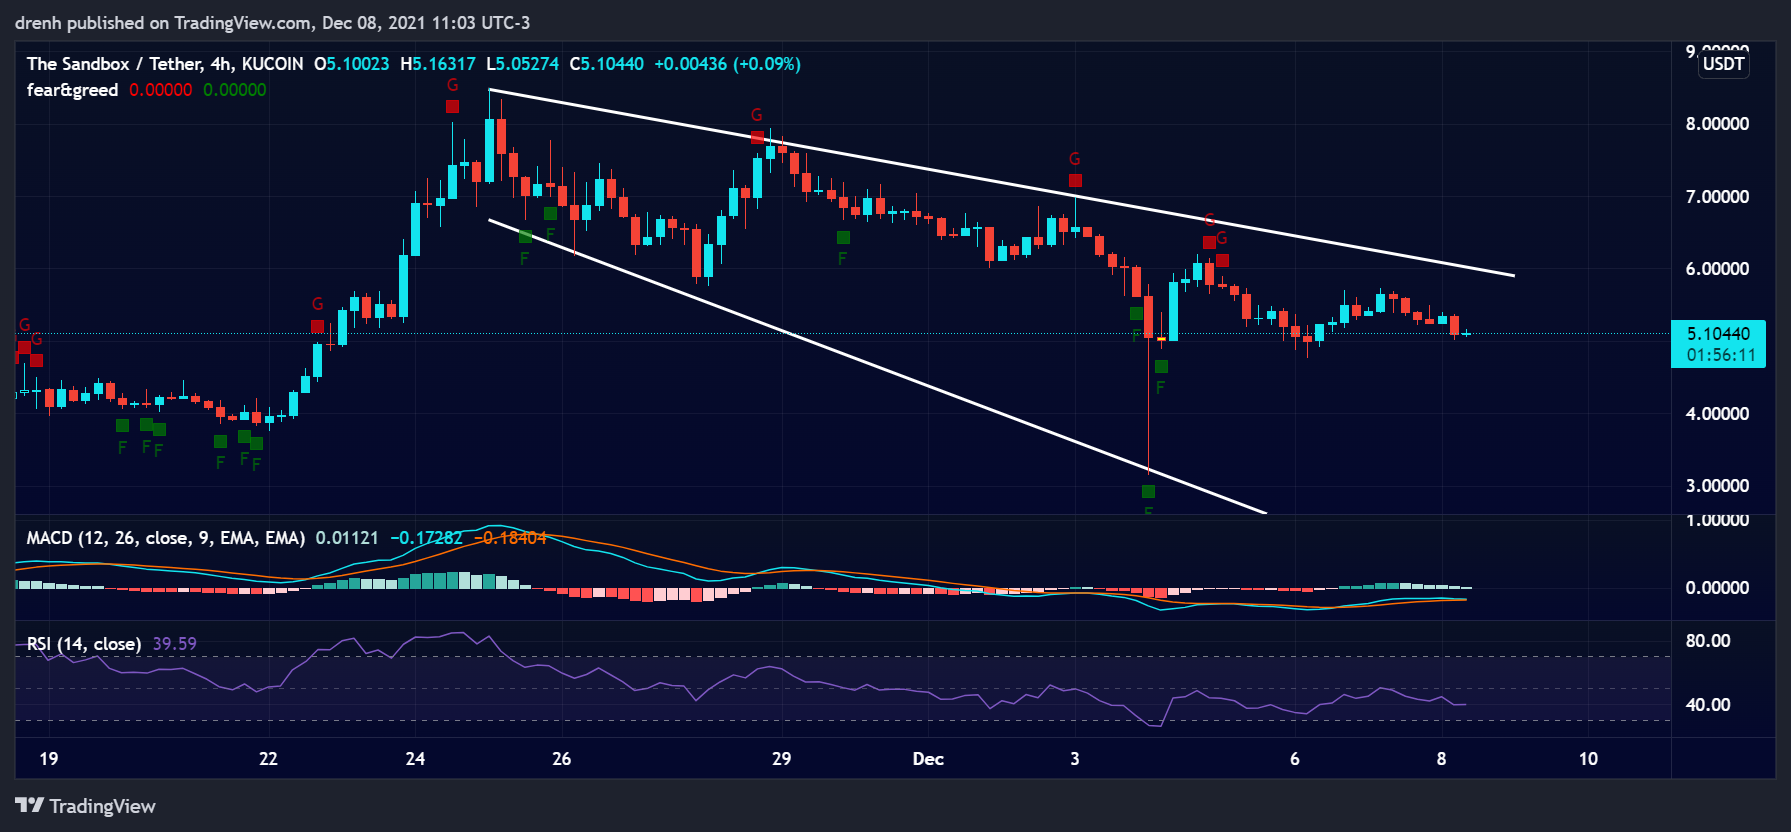
The RSI of a 4-hour chart was recently below 30, indicating that SAND was oversold. This led the price to have a correction. However, the RSI has been declining once again, and it is approaching 30. This indicates that SAND is bearish in the short run.
MACD
The MACD line of a 4-hour chart is slightly above the signal line, but it is below the baseline. Moreover, the lines are converging, which indicates that the momentum can shift in the short run.
Fear & Greed
The fear and greed indicator of a 4-hour chart suggests that the dominating emotion of SAND traders was greed due to the recent correction. However, we could see fear taking over as the price has started declining once again.
Fibonacci
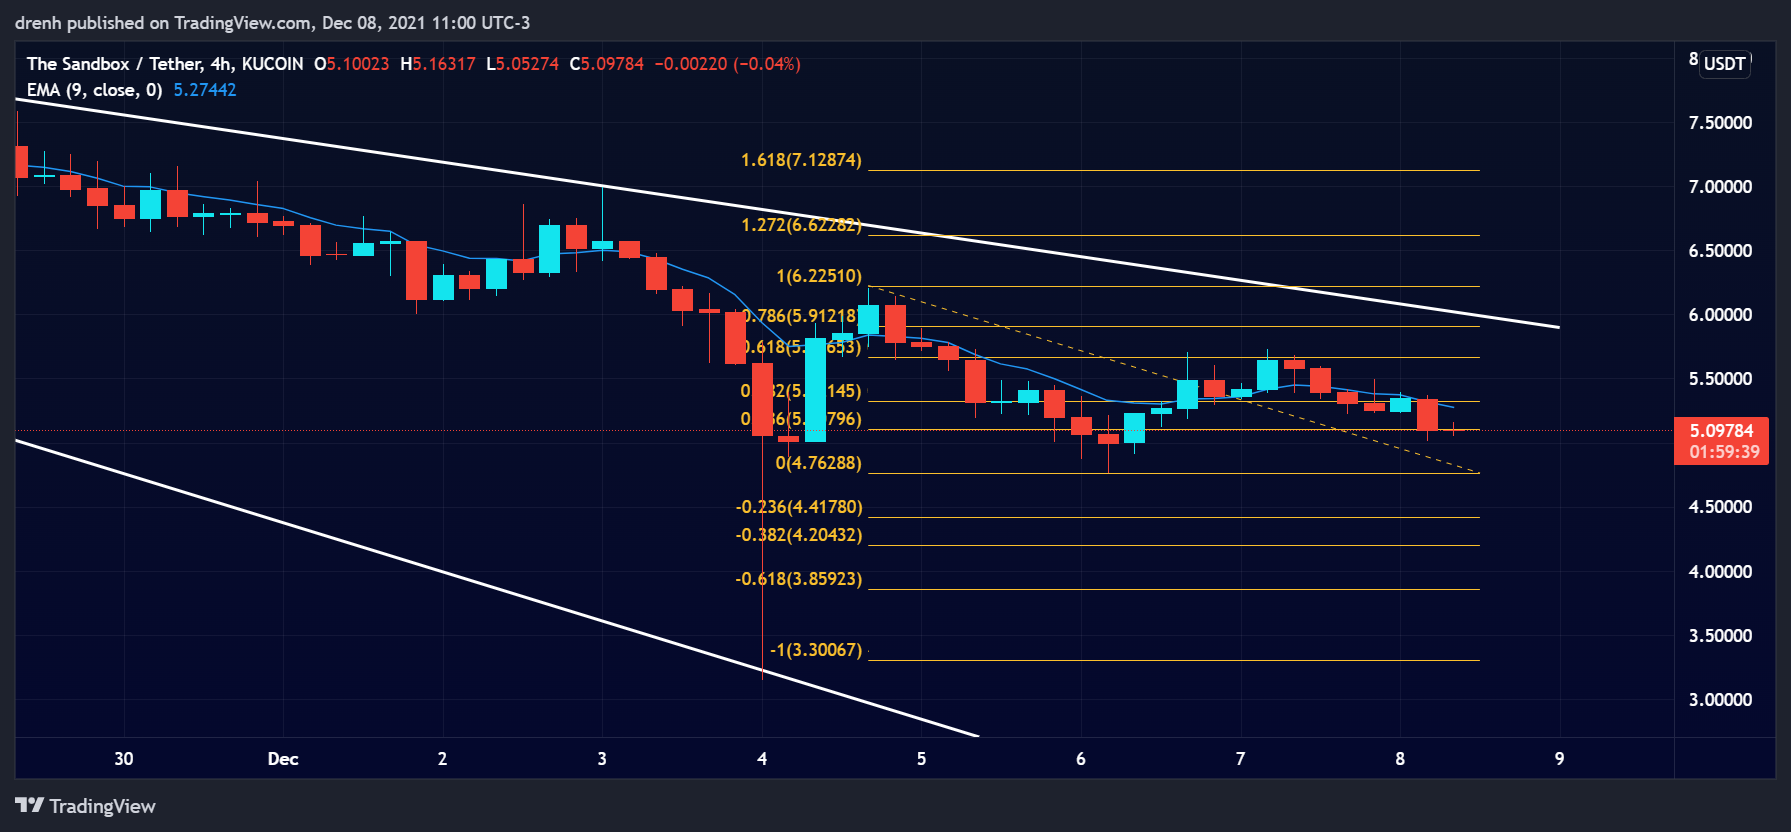
The Fibonacci retracement levels of a 4-hour chart suggest that the price has recently retraced to the 61.8% Fibonacci level. This could see the price of SAND go further below and reach for the Fibonacci extension levels if the price does not find support at our projected structure.
Price Prediction SAND – December 2021
Based on this technical analysis on The Sandbox (SAND), we could see the price of SAND go further down in the short run. If it finds support at $4.75, then a double-bottom could occur and the price could surge upward. However, if the price fails to find support, then it could go below $4 in the coming days. As for the rest of December, if this bull cycle has another leg, and Metaverse coins maintain their hype, then SAND could as well reach a new all-time high in the coming weeks.
Latest News for SAND – Affecting Price
A MetaFlower NFT was recently sold for around $650,000 within The Sandbox network. Such acquisitions could increase the demand for SAND tokens and boost the price upward.
Also read:
Sandbox Price Prediction 2022 and Beyond – Will SAND Reach $100?
Cryptocurrency and Metaverse – What is the Connection Between Cryptocurrencies and Metaverse?