


TEL Technical Analysis – October 2021
Monthly Analysis
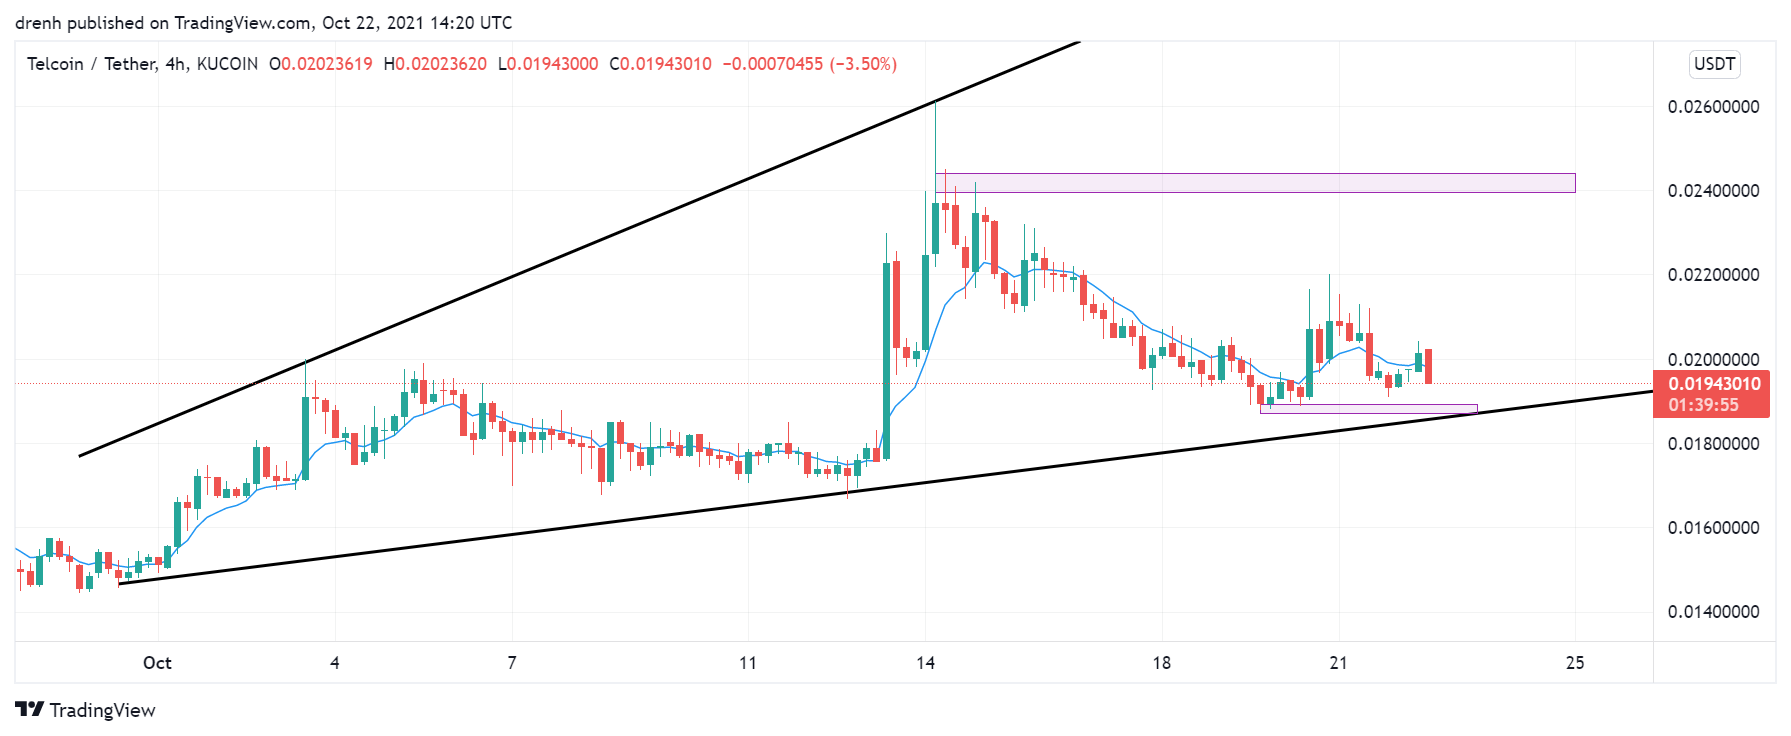
Over the last 30 days, TEL has been bullish due to the market being in a bullish trend. The price of TEL has increased by 94% throughout this period, which is almost 2x in less than a month. After facing resistance at $0.026, TEL started declining after that, and it has retraced by 28% so far. Nonetheless, TEL is still bullish in a 4-hour chart.

Weekly Analysis
In the last 7 days, TEL has been bearish. In a 1-hour chart, the price has dipped by 28%, but it has recently found support at $0.018. After an additional increase of 17%, reaching higher highs and higher lows, TEL declined at the same range.
Daily Analysis
In the intraday chart, TEL has increased by more than 5%. However, the price started declining after that, and it has dropped back to where it was at the beginning of the day.
Key Structures
Support
- $0.018
Resistance
- $0.026
Indicators
Moving Average
The 20-day is currently acting as support to the price of TEL, and it indicates that if TEL finds support soon, then the price can keep increasing in the coming days.
The 9-day EMA has recently moved above the price due to the recent retracement. This indicates that the trend might have reversed and that the price of TEL could decline in the coming days.
Relative Strength Index
The RSI has been declining in recent days, and it is now close to 50. This suggests that TEL has room for growth in a 1-day chart. In a 4-hour chart, the RSI is slightly bearish.
MACD
In a daily chart, the MACD line has now intersected with the signal line and moving below the latter, indicating that the momentum is shifting to bearish for Telcoin. The same applies to the 4-hour chart.
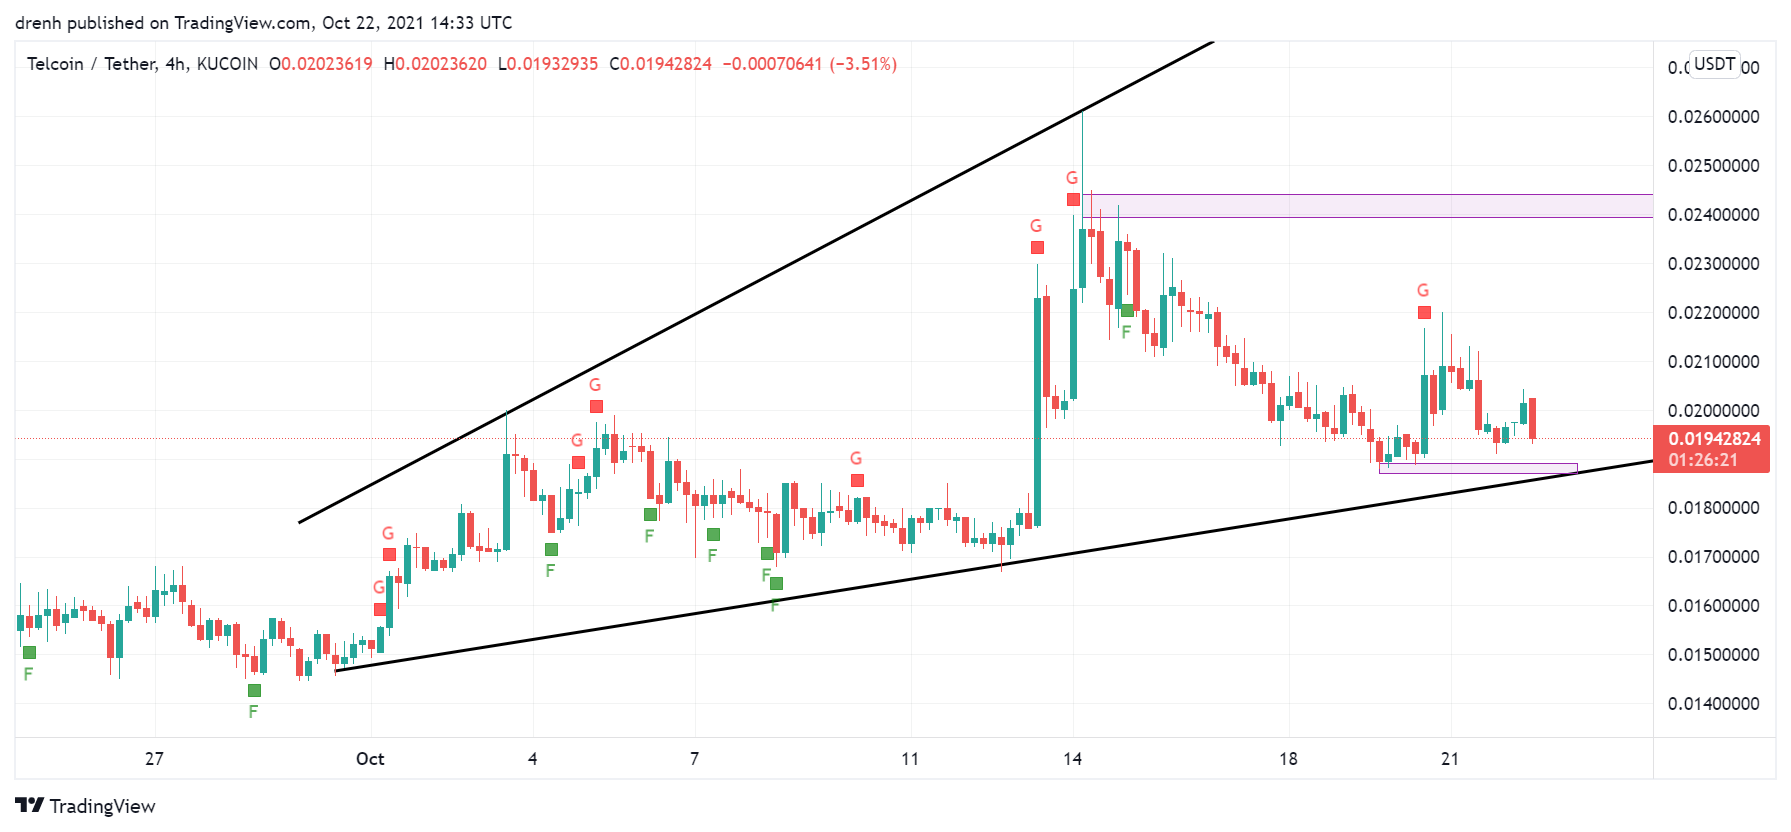
Fear & Greed
The fear and greed indicator of a 4-hour chart suggests that the current emotion of TEL traders is greed, meaning that investors are bullish.

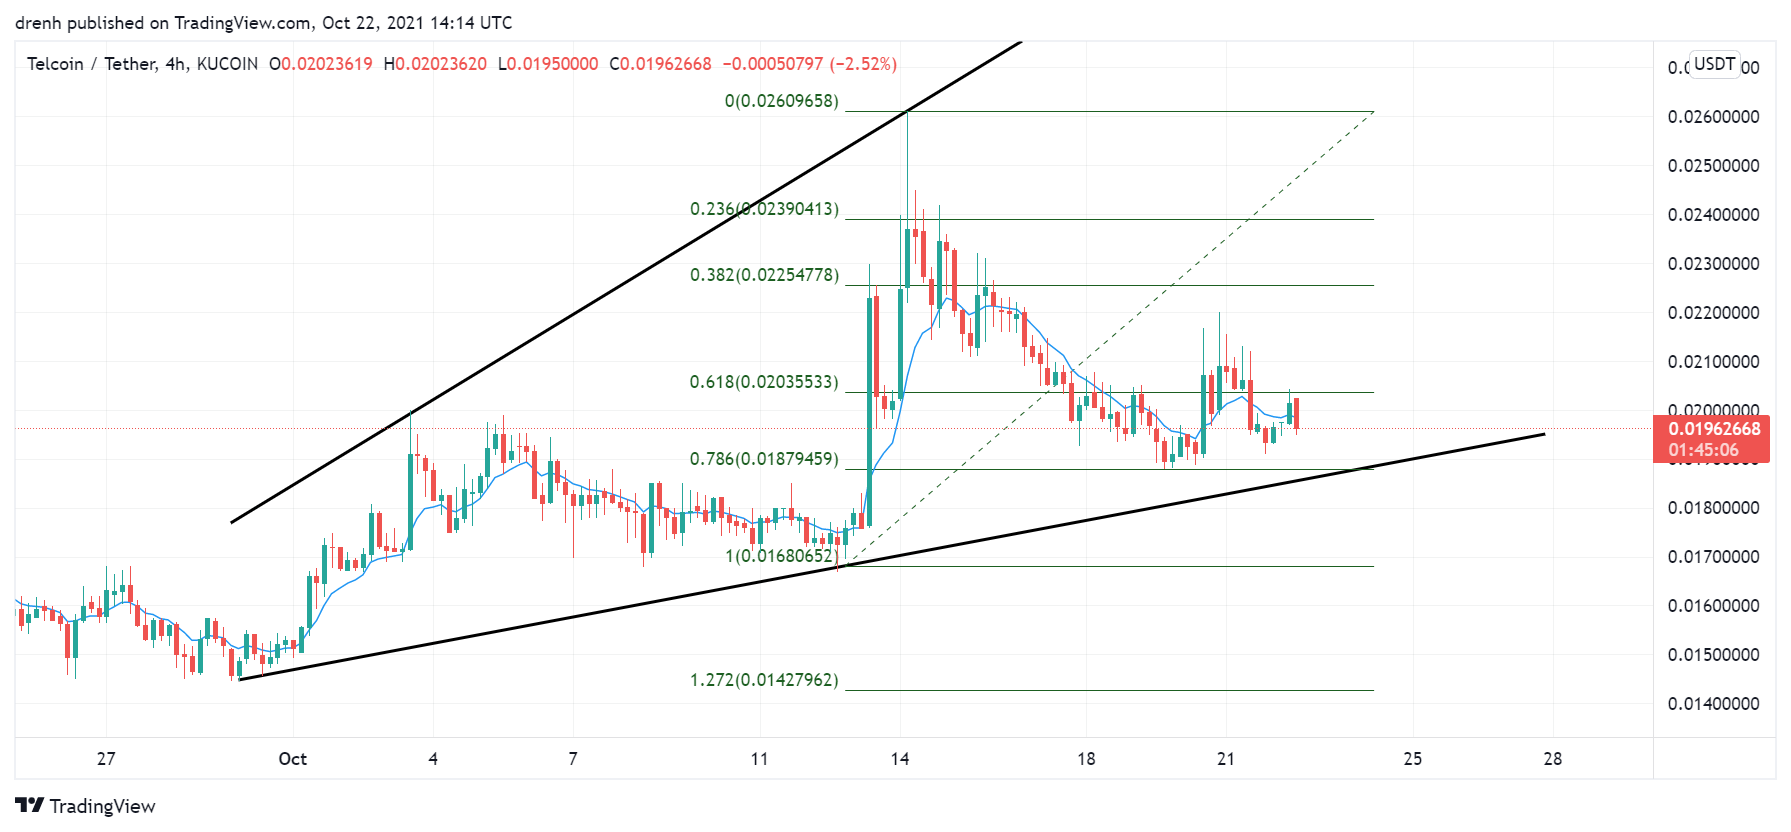
Fibonacci
The Fibonacci retracement levels suggest that the price of Telcoin has recently found support at the 78.6% level. This indicates that the price can increase in the coming days up to at least resistance at $0.026.
Price Prediction TEL – October 2021
Based on this technical analysis on Telcoin (TEL), its price can grow massively if it manages to break resistance at $0.026. If so, then TEL could go for a new all-time high in the coming weeks if the market continues to grow at the rate of Bitcoin. A price of $0.10 is possible for Telcoin in the coming weeks.
Latest News for TEL – Affecting Price
Recently, Bitcoin has reached a new all-time high. Such milestones showcase how much cryptocurrencies can increase. This bullish cycle could prove to be the biggest one so far, and cryptocurrencies such as Telcoin can be largely affected as well.
Also read: Telcoin Price Prediction 2021 and Beyond – Is TEL a Good Investment?