

SOL Technical Analysis – November 2021
Monthly Analysis
Over the last 30 days, SOL has been bullish. The price has increased by around 88%, generating huge profits for SOL hodlers. The price of SOL has recently reached an all-time high at $260. This has placed in the top 5 rankings in crypto market rankings based on market capitalization.

Weekly Analysis
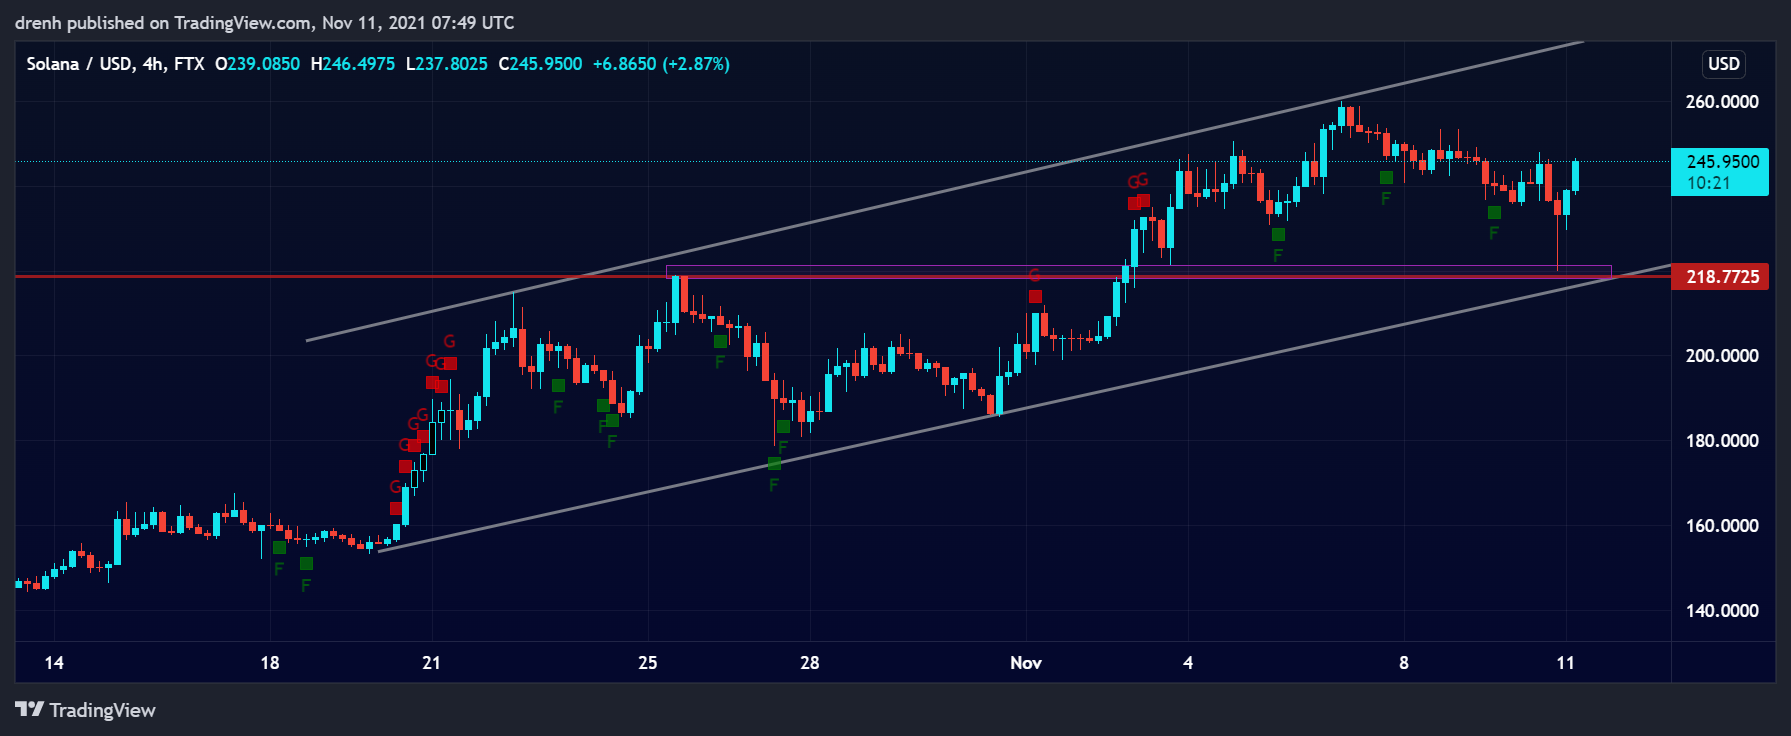
Despite increasing by 12% and reaching a new all-time high in the last 7 days, SOL is now retracing. The price has declined by 15% so far, but it recently found support at $220. This could be an indicator that the trend is now downward, as the new low is lower than the previous one. SOL is currently rebounding, and the upcoming resistance structure may tell if the trend is reversed or not.
Daily Analysis
In the intraday chart, the price of SOL has been rebounding and traders were bullish, taking advantage of the price dip. This has led to an increase of 12% in just the last 24 hours, meaning that buyers can move the price of SOL even higher in the coming hours if SOL does not face resistance.
Key Structures
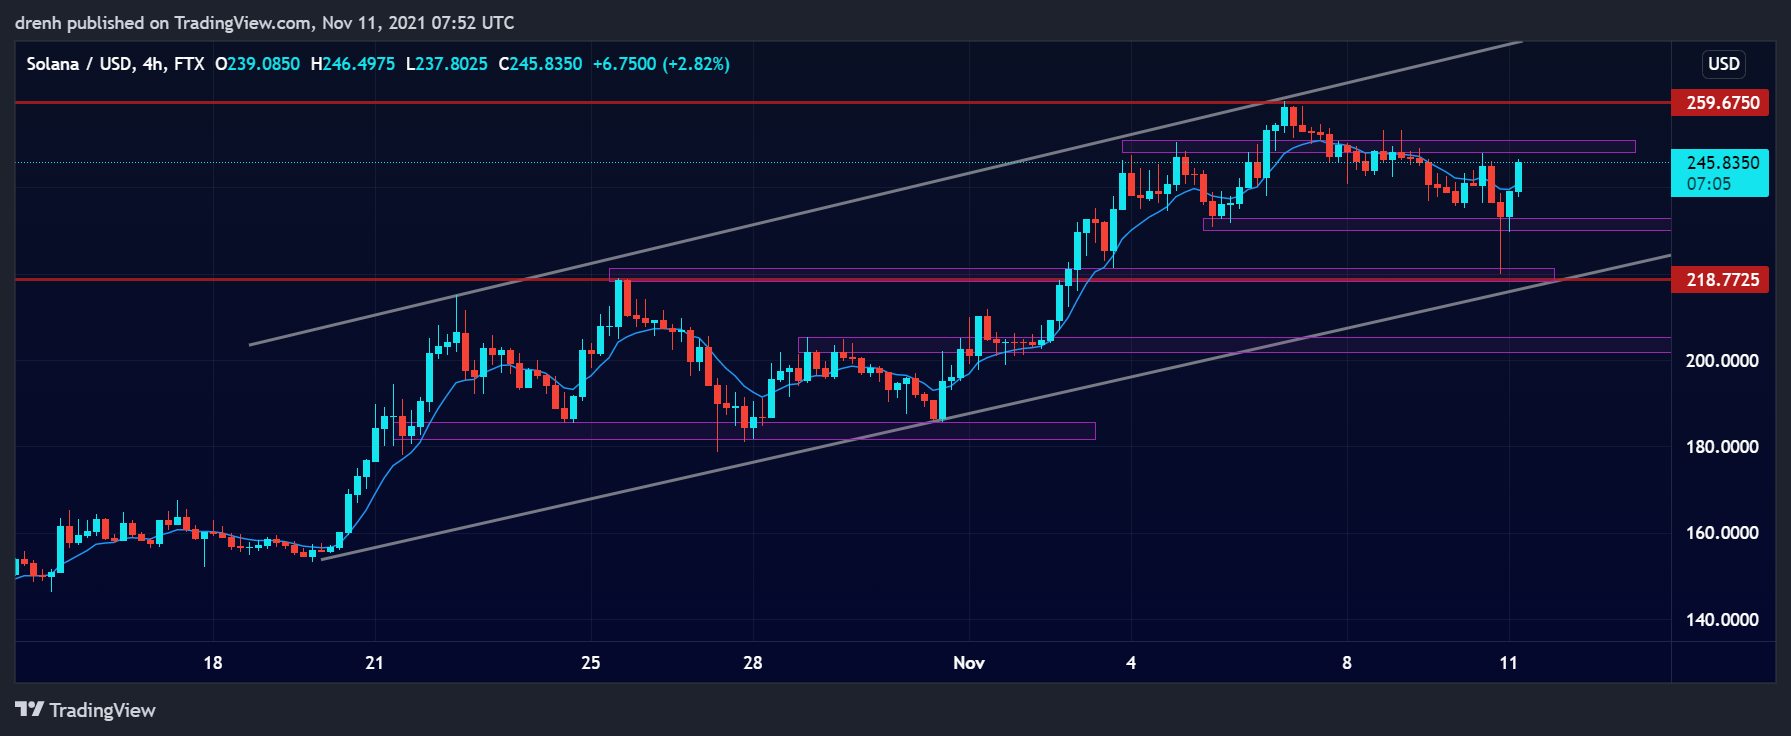
Support
- $219
Resistance
- $250
Indicators
Moving Average
Despite the recent retracement, the 20-day moving average is below the price, indicating that the trend is still upward and that the price of SOL can keep increasing in the coming days.
The 9-day EMA was temporarily above the price, which could have led to a trend reversal. However, SOL is now rebounding and the EMA line is below the price once again. The EMA line could be a good structure of support in the short run.
Relative Strength Index
The RSI of a 1-day chart was recently above 70 and in the overbought region. This was a good indicator that the price would retrace. Currently, the RSI is below 70, indicating that there is room for more growth in the short run.
MACD
The MACD line had been above the signal line of a 1-day chart. However, the lines are now converging and may soon intersect. If that happens, then we could see SOL be in a bearish momentum in the new few days.
Fear & Greed
The fear and greed indicator of a 4-hour chart suggests that the current emotion of SOL traders is fear due to the recent price retracement.
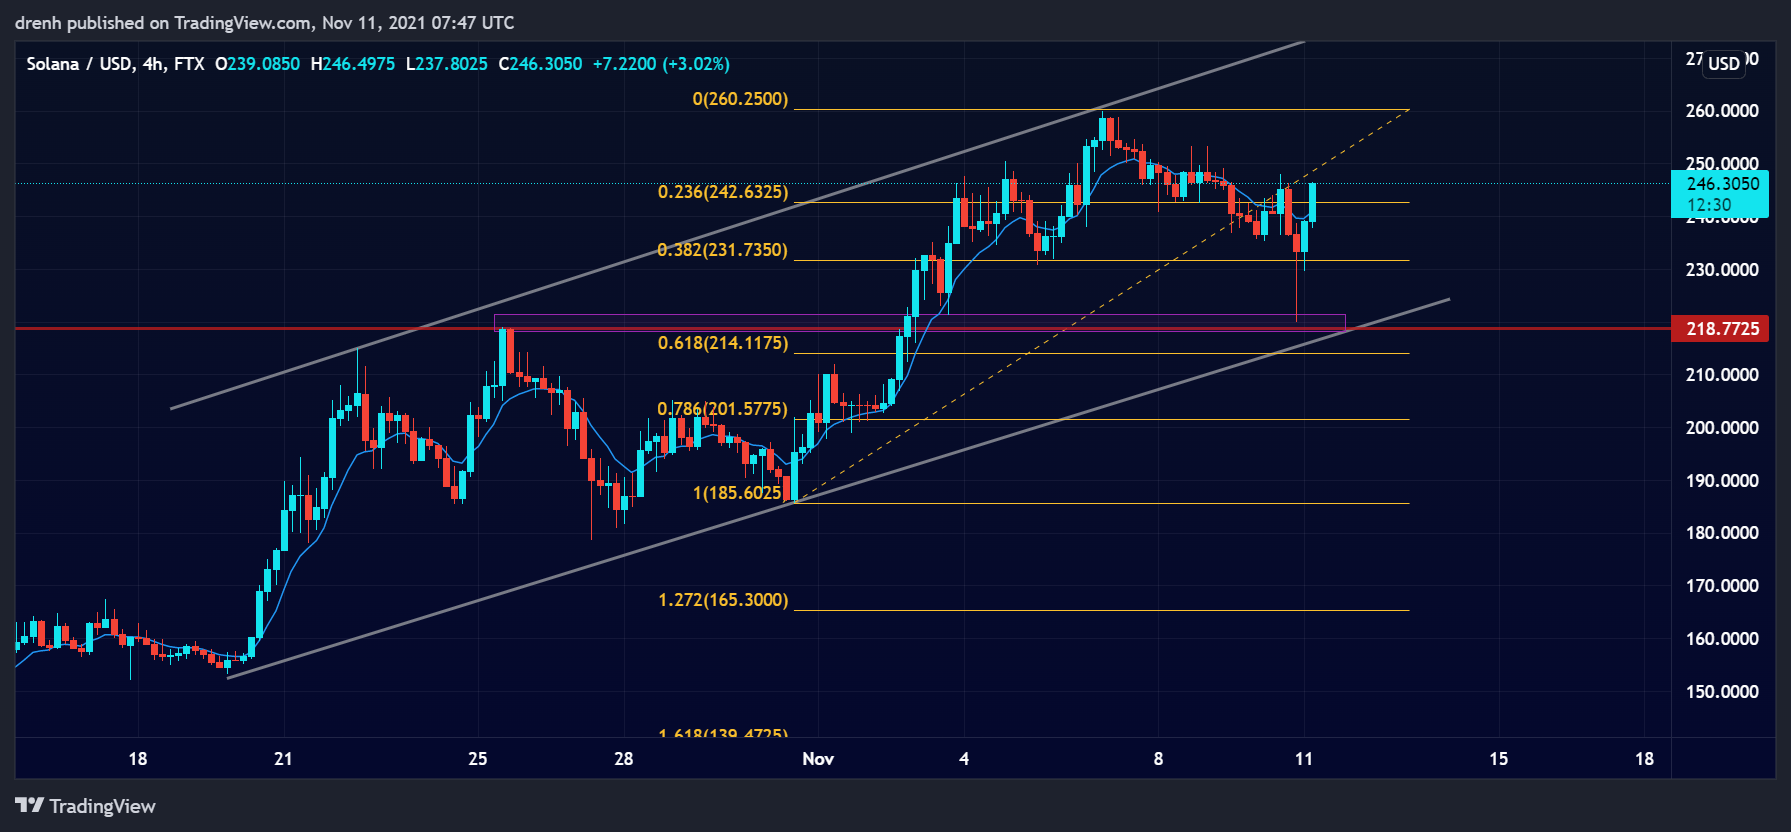
Fibonacci
The Fibonacci retracement levels suggest that SOL has recently found support slightly above the 61.8% Fibonacci level, indicating that the price could surge upward if selling pressure is low at key structures.

Price Prediction SOL – November 2021
Based on this technical analysis of Solana (SOL), we could see its price increase again in the coming days. If resistance at $250 is broken during this rebounding phase, SOL could retest its all-time high. However, if the new high is lower than the previous one, the trend might be reversed, and SOL could go further down. Ultimately, it also depends on how BTC moves in the coming days, as the latter makes up the biggest portion of the whole cryptocurrencies market cap. If BTC approaches $100,000 in the coming weeks, SOL could even go as high as $500. That would place SOL above BNB in market rankings.
Latest News for SOL – Affecting Price
Recently, it was announced that Brave Browser may soon integrate the Solana blockchain and give access to millions of users in the Solana ecosystem. Also, many coins are being launched based on the Solana ecosystem. There are many Solana coins to watch and this can greatly affect the price of SOL in the coming weeks.
Also read: Solana (SOL) Price Prediction 2021 and Beyond – Is SOL a Good Investment?