

SOL Technical Analysis – December 2021
Monthly Analysis
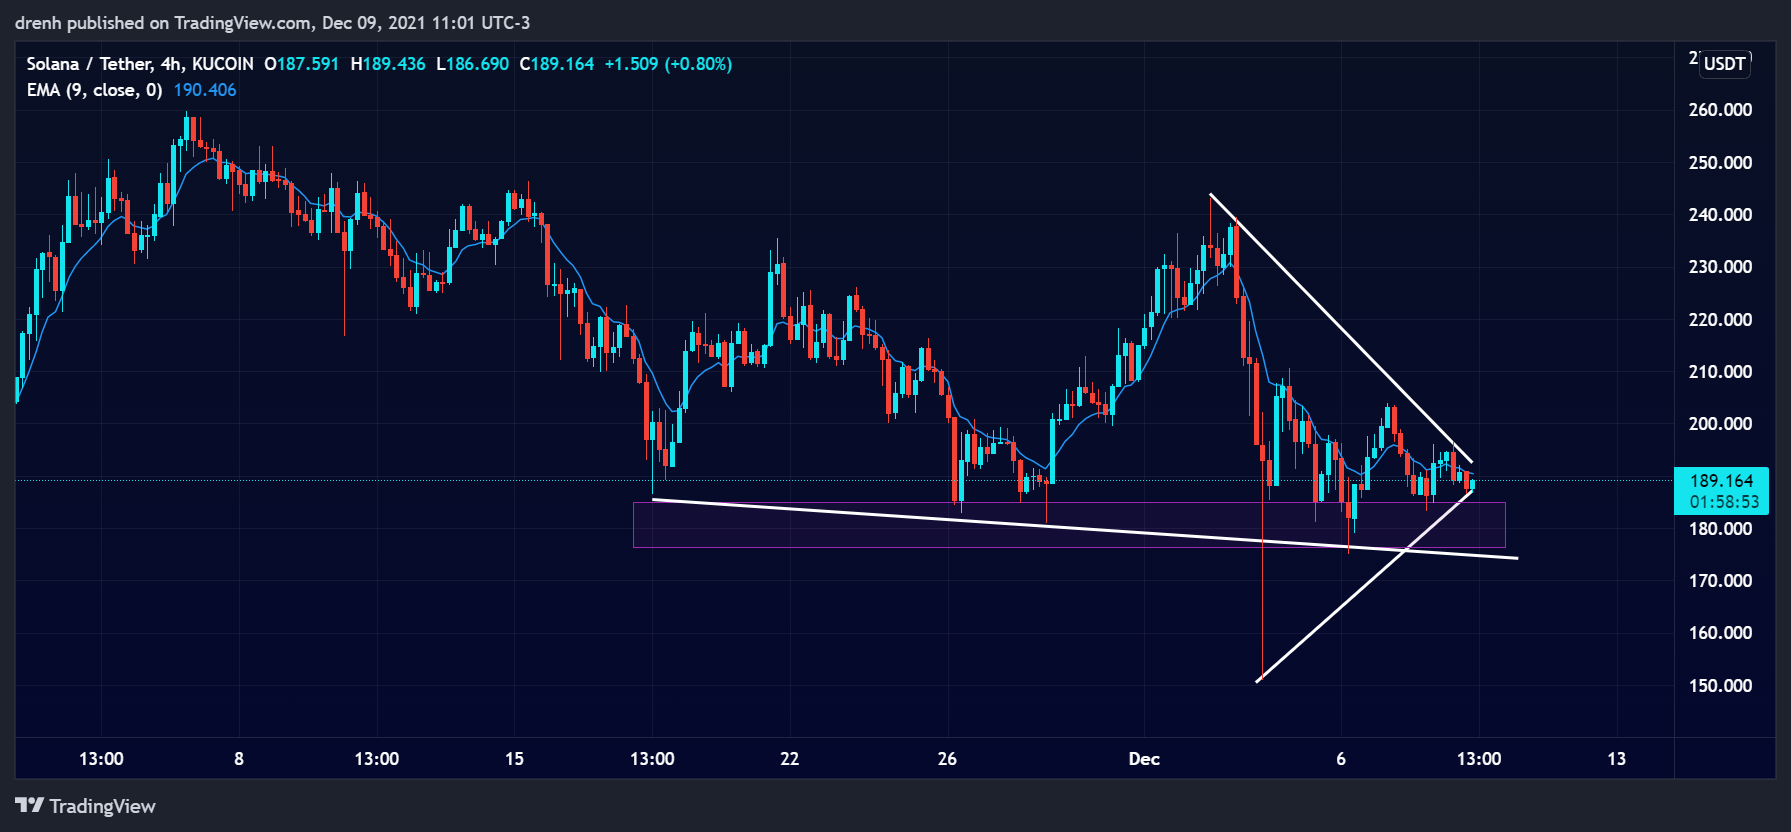
In the last 30 days, the price of SOL has fluctuated at large rates. The price initially declined by 28%, but it then increased by 26% after finding support at $186. After another decrease of 23%, the price increased by 34% but it faced resistance at $243. The price had a bearish breakout of 38%, hinting that the downtrend may continue for SOL. The price has been in a correction after that. A triangle pattern has formed, indicating that another breakout could occur soon.

Weekly Analysis
In the last 7 days, SOL has been bearish. After the price declined by 38%, it found support at $151. After that, the price formed a triangle pattern, indicating that a breakout could occur soon. SOL remains bearish in the short run.
Daily Analysis
In the intraday chart, SOL has been highly volatile, and it has declined by around 3%. The price is currently going upward again, but it may continue declining in the coming hours. The SOL remains bearish in the intraday chart as well.
Key Structures
Support
- $180
Resistance
- $205
Indicators
Moving Average
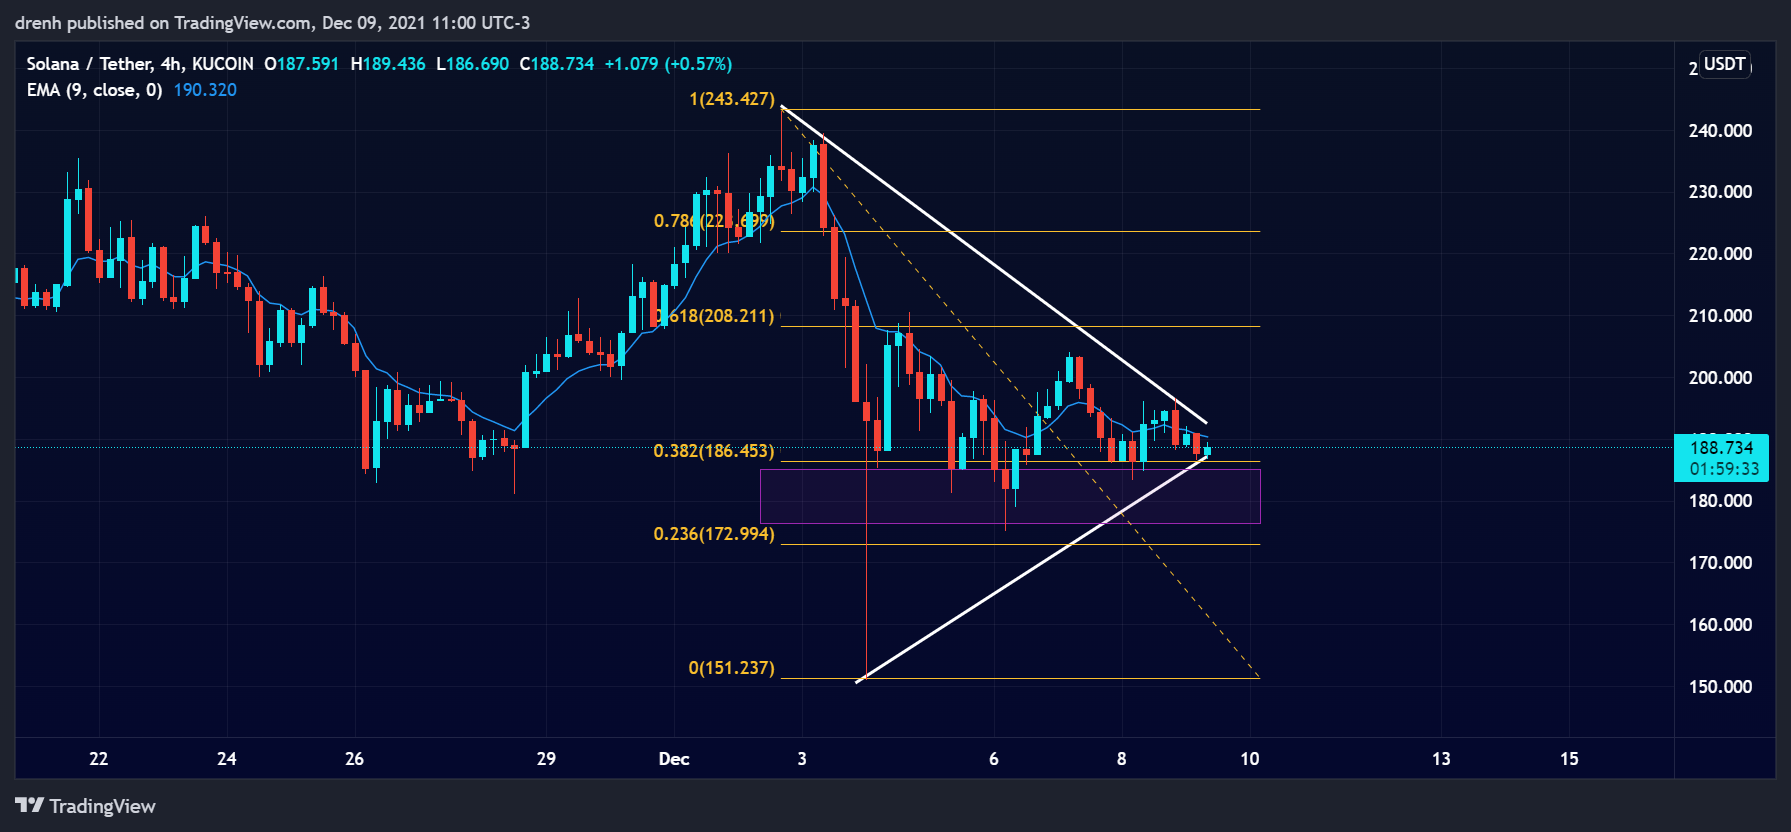
The 20-moving average of a 4-hour chart is above the price, indicating that Solana is in a downtrend and that the price of SOL could keep declining in the coming days.
The 9-EMA of a 4-hour chart is also currently above the price, indicating that SOL is bearish in the short run. Furthermore, the EMA line could act as resistance to the price if the latter attempts to increase.
Relative Strength Index
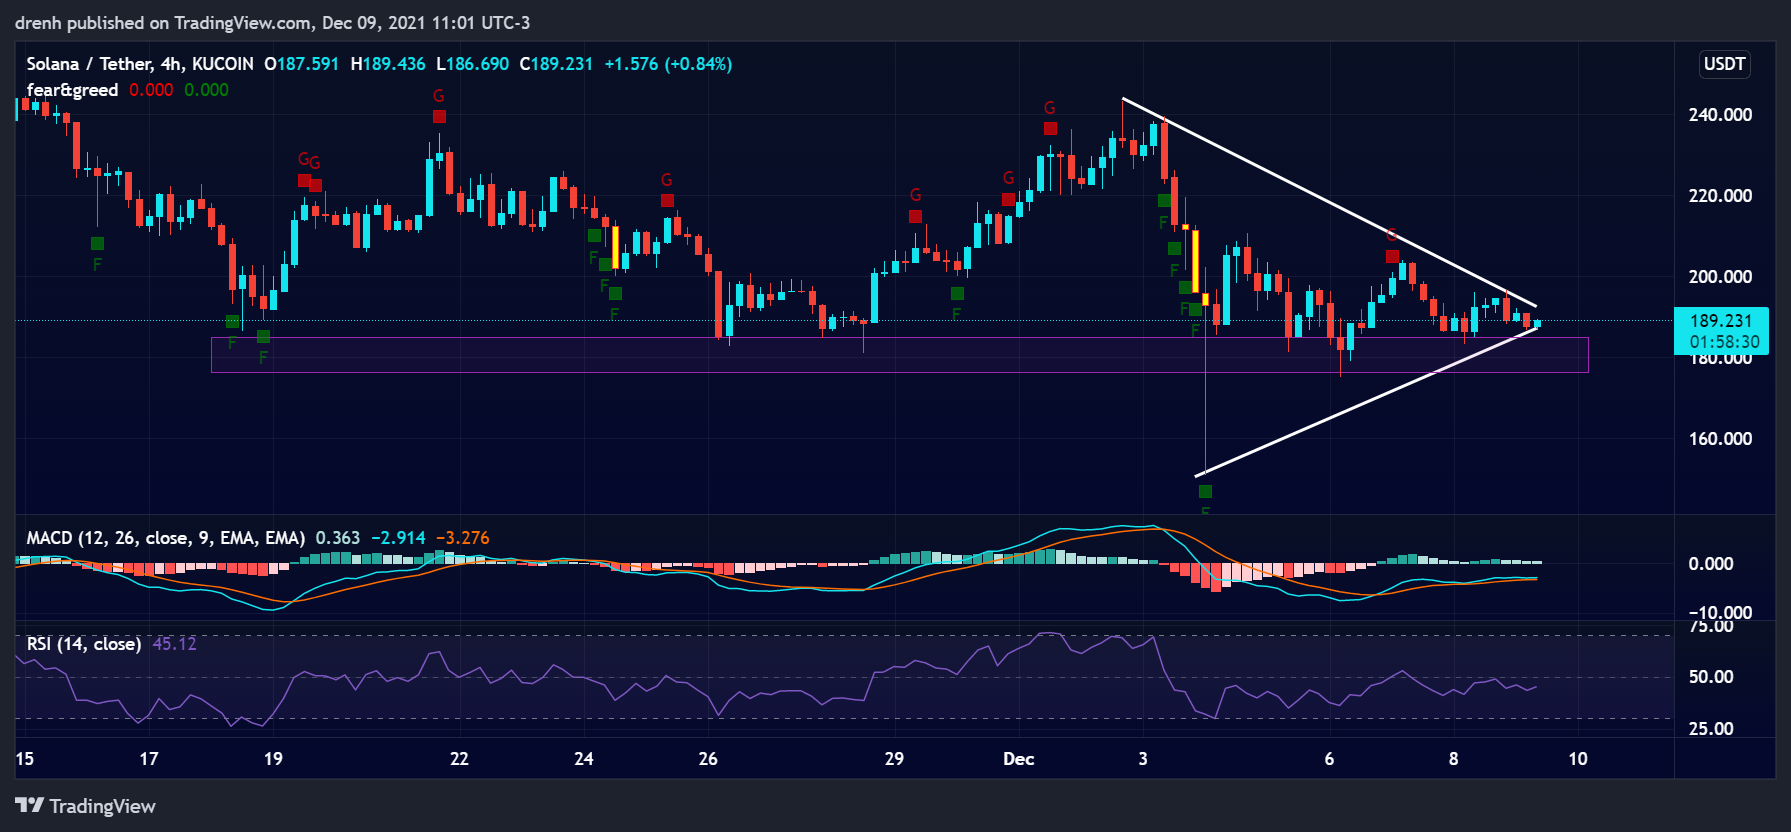
The RSI of a 4-hour chart is within the 30-70 range, but it is slightly below 50. This indicates that SOL is bearish, but it also shows that it has a lot of room for growth in the coming days.
MACD
The MACD line of a 4-hour chart is slightly above the signal line but below the baseline. This suggests that the momentum is building up to be bullish for SOL. However, the lines are close to one another, so a shift in momentum could occur easily.
Fear & Greed
The fear and greed indicator of a 4-hour chart suggests that the current emotion of SOL traders is greed due to the recent correction. This could easily turn into fear if the price keeps declining in the coming days.
Fibonacci
The Fibonacci retracement levels of a 4-hour chart suggest that the price of SOL retraced to the 61.8% level after the recent bearish breakout. That could lead to the price going further down in the coming days, other things equal.
Price Prediction SOL – December 2021
Based on this technical analysis on Solana (SOL), the price could soon have a breakout. If buyers take over once again, we could see SOL head upward and face resistance at around $215. In the weeks after that, SOL could aim for a new all-time high. However, if SOL has another bearish breakout, the price could go below $130 in the coming days.
Latest News for SOL – Affecting Price
Monkey Ball, a Solana-based play-to-earn game, has recently gained a lot of attention, and it has received fundings from major companies such as Gate.io, Alameda Research, etc. This could drive the demand for SOL upward in the coming weeks.
Also read:
Solana (SOL) Price Prediction 2021 and Beyond – Is SOL a Good Investment?
Solana Left Cardano and Ethereum Behind to Become the Most Staked Crypto
Best Cryptocurrencies to Buy Right Now – 4 Trending Cryptocurrencies to Watch
Reddit Co-Founder and Solana Ventures Join Forces For $100 Million Social Media Project Initiative