

SOL Technical Analysis – August 2021
Daily Analysis
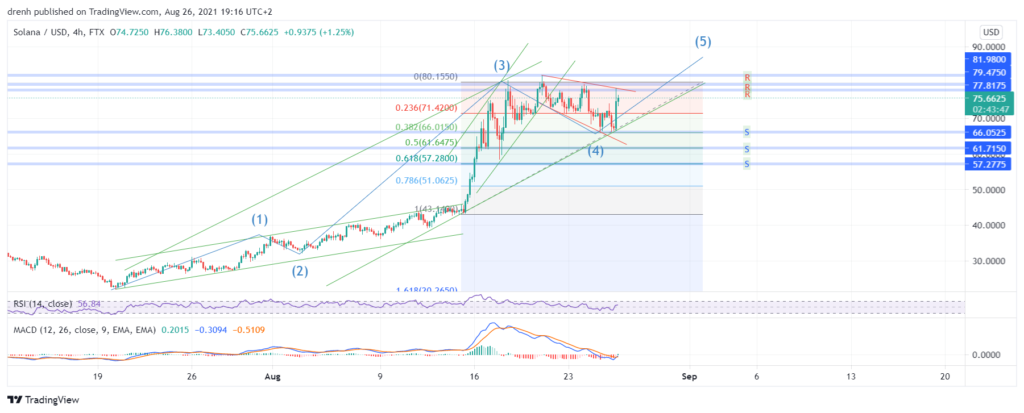
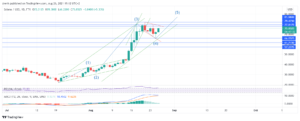
Solana has recently reached a new all-time high at $81.9. This increase has started on July 20th, marking a 270% increase throughout this period. After reaching this new high, SOL has had a correction, but it does not necessarily suggest that the trend may reverse. If SOL finds support, it can aim to set a new price record.
Intraday Thoughts
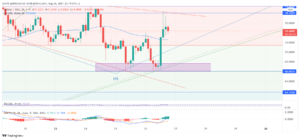
Volatility has been considerably high these past few days as Solana is on the biggest bullish run of its lifespan so far. SOL has recently found support at $66, and it is now testing resistance levels. This is key to determine whether SOL can continue this increase or is now in a downtrend.

Key Structures for Solana
Support
- $66, $61, $57.
Resistance
- $78, $79.5, $81.9.
Indicators
Moving Average
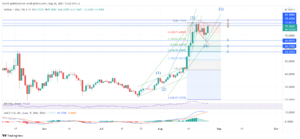
The 20-day moving average of Solana suggests that SOL can keep going at this rate as the candlesticks are way above the MA line, and the latter may act as a level of support for the days to come. In a 4-hour timeframe, the MA support was broken and it was meant to serve as resistance, but then it was broken again as candlesticks have emerged above it.
Relative Strength Index
The RSI might be somewhat alarming to traders since it is above 70. This means that SOL is being overbought, and traders may soon begin to sell more. This is one of the indicators suggesting that SOL might now be in a downtrend, after recently hitting a new all-time high.
MACD
MACD is way above the baseline, and the MACD line is above the signal line. This can only mean that the momentum is continuing. That is not the case in a 4-hour chart since MACD has recently dropped below the baseline. Nevertheless, the momentum is shifting, meaning that this price decrease might have simply been a pullback rather than a reversal
Fibonacci
Looking at the Fibonacci retracement, SOL has found support at 38.2%. Another level of support can be 50% and 61.8%. These levels also align with the projected descending channel that started from Solana’s all-time high.

Head And Shoulders
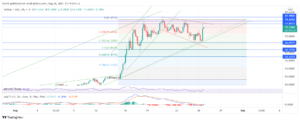
A head-and-shoulders pattern was recently formed, with the head being Solana’s new price record. Since the neckline support was broken, Solana may have reversed and may now be in a downtrend. However, support at $66 could be the reason why SOL can start increasing again

Double Bottom
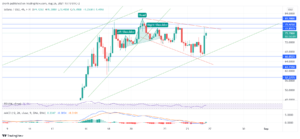
A double bottom pattern can be noticed in a 2-hour chart. Since none of the candlesticks in the second bottom closed below the area of support, then SOL can easily soar upwards in the coming hours or days.

Elliot Waves
From the beginning of this bullish run of Solana, we can also notice the Elliot waves shaping, with four of the waves potentially finished. The last impulsive wave can see Solana break a new price record in the coming days.

Price Prediction Solana – August 2021
Judging by this technical analysis, Solana’s astonishing increase might not be over. While a recent correction has decreased the price of SOL, it can easily aim upwards to break resistance levels due to the recent double bottom pattern, momentum indicators, and strong zones of support stopping a downtrend. Solana can reach a new all-time high in the coming days.
Latest News for Solana – Affecting Price
Recent Solana news might be another indicator that this cryptocurrency can increase. To illustrate, Solana has just integrated Chainlink in its network so that Solana users can exploit decentralized price feeds. Pyth Network, a data oracle network based in Solana, is launching very soon.
If you want to learn more about Solana, check out this article:
Solana (SOL) Price Prediction 2021 and Beyond – Is SOL a Good Investment?