

SOLUSD Price Analysis – August 05
The price may reach and break above the resistance level of $42 provided the bulls increase their pressure; above it are $49 and $55 resistance levels. Should the $42 resistance level holds, the price may break down the support level at $33, further increase in the bears’ pressure may push down the price to $23 and $18
SOL/USD Market
Key levels:
Resistance levels: $42, $49, $55
Support levels: $33, $23, $18
SOLUSD Long-term Trend: Bullish
SOLUSD is bullish on the daily chart. The price action has formed a triple bottom price action at the support level of $23. The first touch was on 23 May, the second touch was on 21 June while the coin repeated the testing of the mentioned support level on July 20. Bullish engulfing candle formed on July 21. Solana dance to the tune of the bulls increased pressure, the resistance level of $33 was penetrated and retest was carried out. The coin is currently heading towards the resistance level of $42.

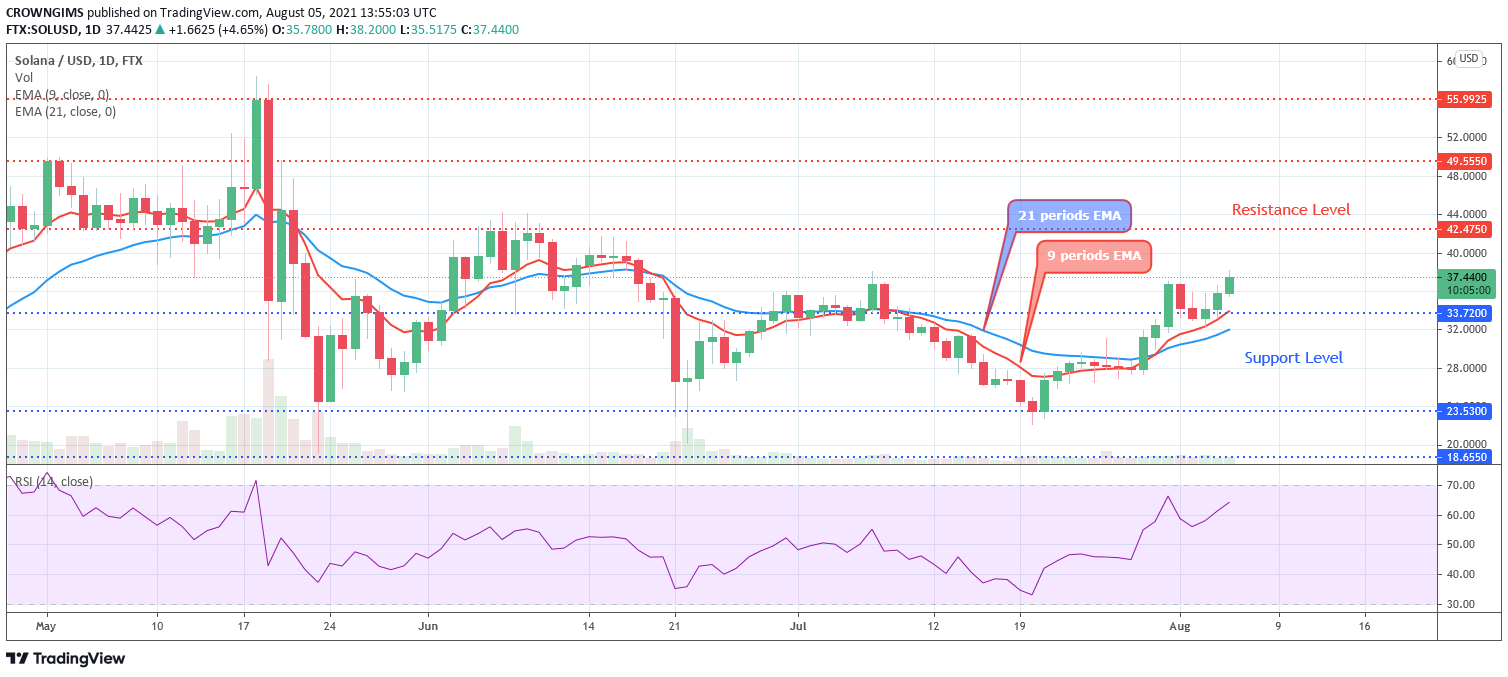
The fast Moving Average (9 periods) has crossed the slow Moving Average (21 periods EMA) upside and the price is trading above the two EMAs as a sign of bullish movement. The price may reach and break above the resistance level of $42 provided the bulls increase their pressure; above it are $49 and $55 resistance levels. Should the $42 resistance level holds, the price may break down the support level at $33, further increase in the bears’ pressure may push down the price to $23 and $18. The relative strength index period 14 is pointing up at 60 levels to indicate a buy signal.
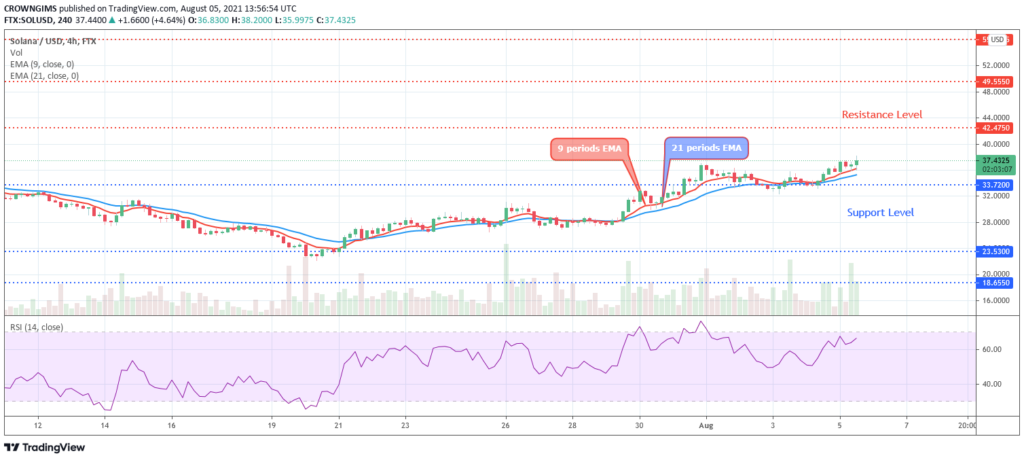
SOLUSD medium-term Trend: Bullish
SOLUSD is bullish in the 4-hour chart for more than two weeks. The crypto bottomed at the support level of $23 on July 20. The price bounced and increases towards $33 price level. The resistance level could not hold the price, it was penetrated and increase towards the $42 price level.

The two EMAs are separated from each other and the currency pair is trading above the 9 periods EMA and 21 periods EMA which indicates that bulls are reigning in the SOLANA (SOL) market. The relative strength index period 14 is at 70 levels and the signal lines pointing up to indicate buy signal.