

Solana has quickly jumped to the forefront of the cryptocurrency market after its launch in 2020. Where Ripple failed, Solana marveled. Our Solana price analysis reveals strong resistance for the cryptocurrency owing to the quickly reaching oversold mark.
Solana reached the year-to-date (YTD) high on the 2nd of January 2022, when it hit the $178.74 mark, the same day when Binance Coin also enjoyed the YTD high. Following the market movement, SOL price also dipped down to $136 within the next week and to the $80 mark in the week to follow. Although the price touched the $140 mark in April 2022, the price movement has been bearish since.
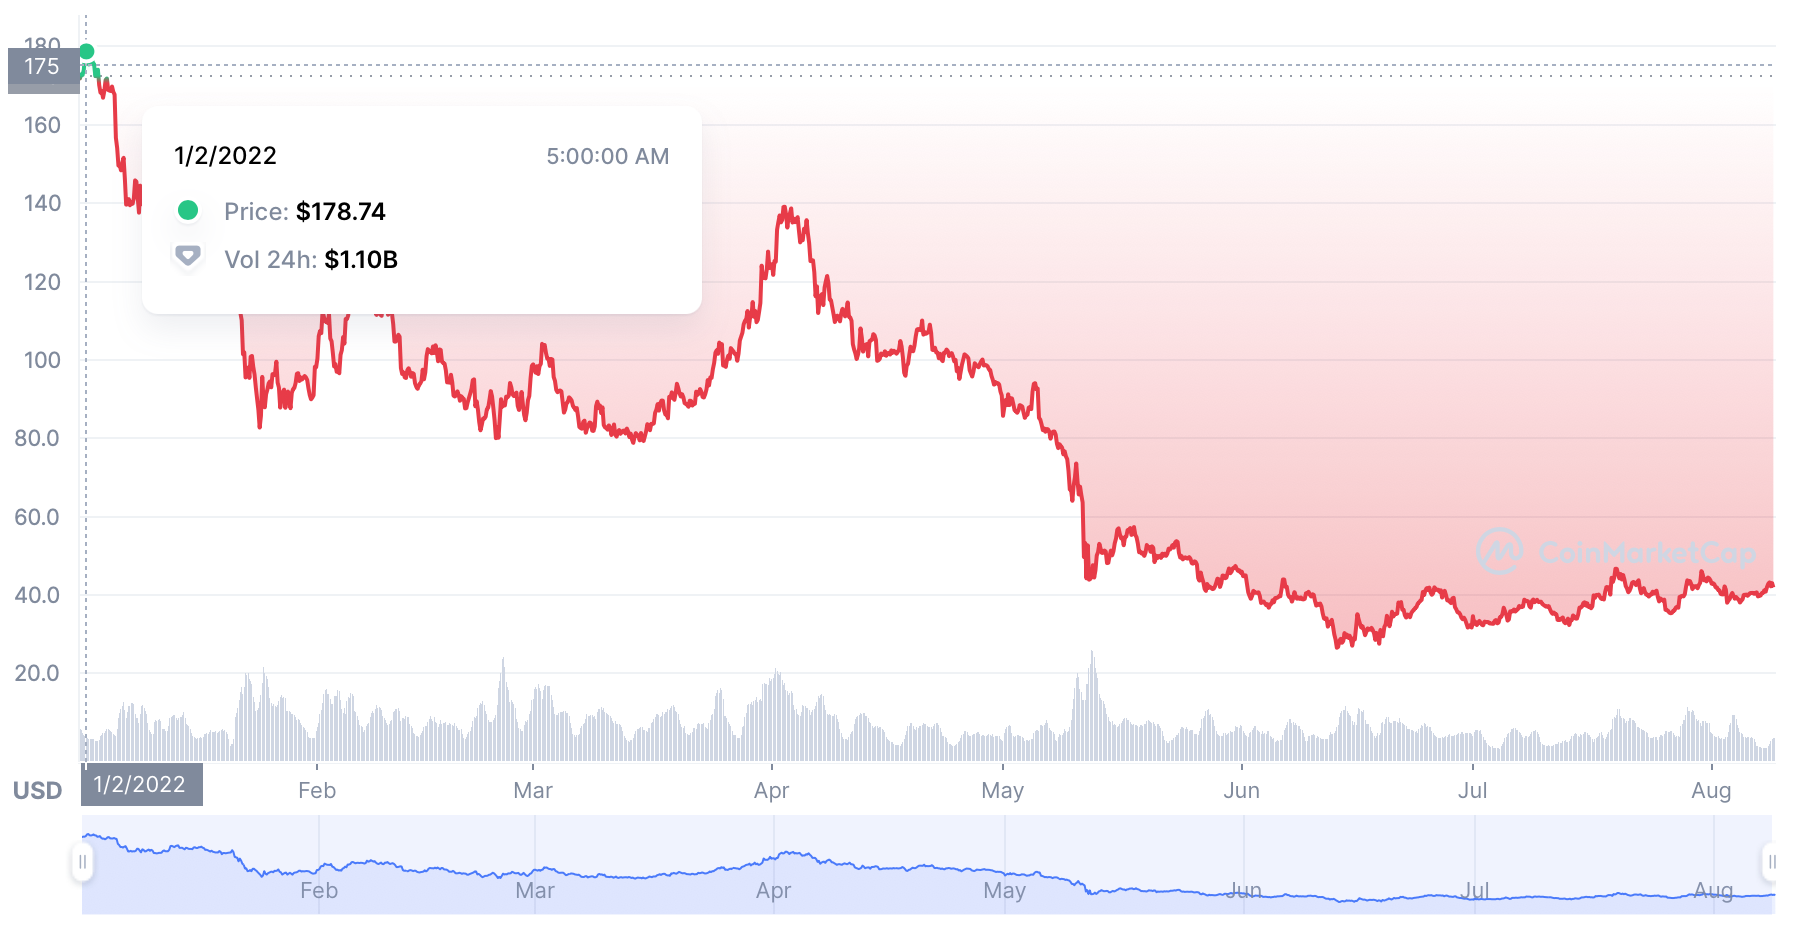
Solana price chart by CoinMarketCap

The Solana ecosystem depends largely on the reliability of the transaction system, and the Solana ecosystem that rapidly expanded in the past two years. However, the year 2022 has been slower for the ecosystem chaining the SOL price down with the overall market. Several DEXs, lending protocols, and new projects manage to keep the cryptocurrency in the top 9 across the globe.
Solana Price Analysis: SOL $40 dip likely if oversold
Solana price analysis reveals an independent movement that is tantamount to a top-rated cryptocurrency. However, the market indicators do not look as promising as in the past week; while the inflation rates across the globe are on the rise, most daily traders now focus on quick buying and releasing to make ends meet.
The overall global shift in sentiments with the rise of different fear factors has changed the daily trading trend for the crypto and forex markets alike.
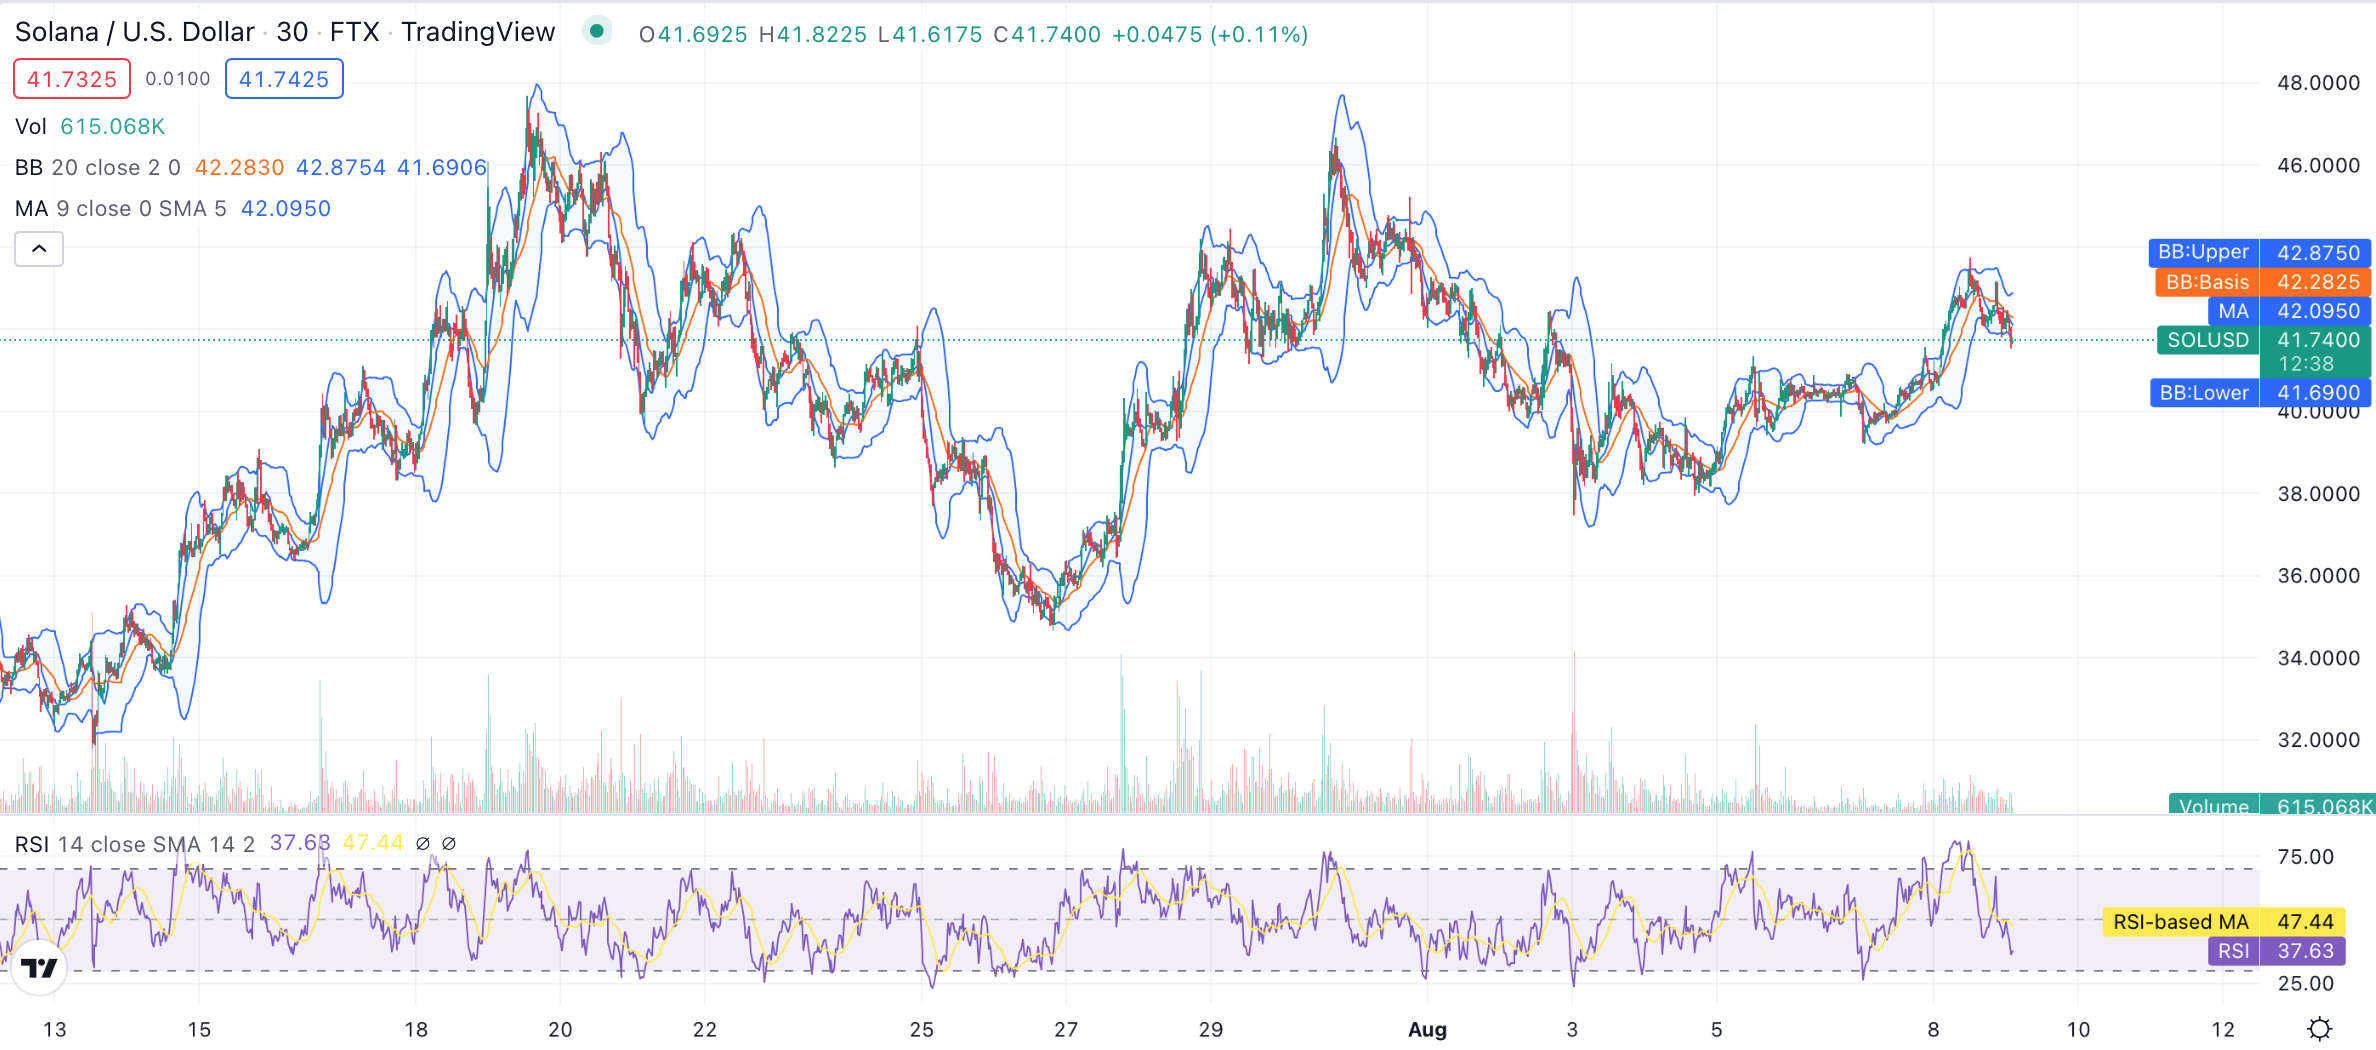

The relative strength index (RSI) is a strong analysis indicator that can be the determiner in several conditions. In the current SOL price movement, the RSI is showing worrisome results for the day traders.
At the time of writing, the RSI score stands at the 37.63 mark; however, in the past week, it has hit below the dangerous 25 score line thrice already, whereas the oversold line found at the 75 score shows the same result. This is an indication of the quick buying and selling market trend by day traders in large numbers. Whale movements can cause ripples; however, they are unable to create such a trend.
Although the RSI moving average (MA) stands at the 47.44 neutral score, the aforementioned factors carry more weight than the MA score.
The trend chart further confirms the weaknesses in the current price movement. At the time of writing, SOL price stands at the $41.47 mark, with only the Bollinger Band lower providing some level of support at the $41.698 mark. On the other hand, the moving average poses the first resistance at the $42.09 mark, while the Bollinger Band average (BB: Basis) marks the second resistance level at the $42.28 mark.
The strongest resistance is found with the Bollinger Band upper limit at the $42.87 mark making the price movement heavily laden by the bearish weight on the cryptocurrency.
The Solana price movement heavily depends on the RSI factors at the time of writing; if the buy/sell trend remains within the neutral numbers, the price is likely to stay stable within the current range. However, the more likely conclusion is an oversold trend with a dip to $40 and further below to $38 level.
Take Aways
- Solana price is facing strong sway due to buy/sell trend.
- SOL price likely to dip down to $40 level.
- Strong resistance is also pulling the price down.
- Day traders to set the market trend in the week.
Disclaimer: The information provided on this page is most accurate to the best of our knowledge; however, subject to change due to various market factors. Crypto-Academy encourages our readers to learn more about market factors and risks involved before making investment decisions.