


SC Technical Analysis – September 2021
Monthly Analysis
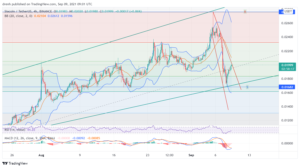
Over the last 30 days, SC increased by more than 75%. This increase was marked with a price of $0.027. Nonetheless, the price dipped after that to $0.0168. After this decline, SC has been attempting to increase again. If SC is now in a downtrend, this increase might just be a correction, but SC could as well attempt a rebound and retest resistance at $0.027 this month, other things equal.

Weekly Analysis
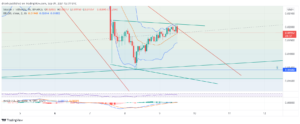
Over the last 7 days, SC increased by 35%, but then it declined by 38%. In the last couple of days, SC has started increasing again, but the short-term trend is now downwards.
Daily Analysis
In the last hours of the intraday chart, SC has increased by 6%. The intraday trend is upwards and SC might attempt to increase more in the coming hours. SC might find support at $0.017, which may also determine the future price of SC.

Key Structures
Support
- $0.017
Resistance
- $0.027
Indicators
Moving Average
The 20-day moving average is now above the price due to the recent price decline. This indicates that SC might now be in a downtrend and that this MA can act as resistance in the coming days. The 50-day moving average is still below the price and has recently supported SC, and it may keep supporting it in the longer run.
The 9-day EMA is also above the price now and might prove to be a good structure of resistance in the coming days.
Relative Strength Index
The RSI was recently above 70, indicating that SC was overbought. Hence, SC declined since sellers knew that SC might eventually drop. Currently, the SC is below 50, indicating bearish momentum, but it also means that SC can attempt to increase again due to the space for growth in the RSI chart.
MACD
The daily MACD line is now above the signal line and headed below the baseline. This is another indicator that the current momentum is bearish and that the price might go down further in the shorter term.
Fibonacci
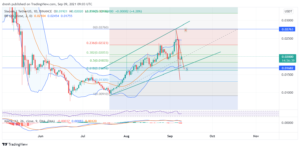
Drawing the Fibonacci levels from the beginning of the uptrend, we can see that SC is yet to retrace to the 61.8% level. If SC finds support there, the price might rebound and aim to go for the -3.6% Fibonacci extension level.

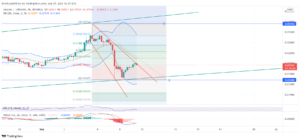
From the recent downtrend, we can see that the price might go to the 38.2% level in the coming hours. If it stops there, then we might see SC go further down to $0.014.

Price Prediction Siacoin – September 2021
Based on this technical analysis, it is forecasted that SC can aim to retest resistance at $0.027 in the coming days if support at $0.017 is strong. If the rebound fails, then SC might as well go down and go close to $0.01
Latest News for Siacoin – Affecting Price
There is no relevant news that could have affected the recent price of SC. However, cryptocurrencies, in general, are affected by BTC. Since BTC had an unanticipated dip recently, the price of SC also declined. If Bitcoin may keep increasing in the coming days, then SC might soar higher as well.
Also read: Bitcoin to Reach $250,000-$400,000 by 2022, According to Raoul Pal