


SC Technical Analysis – November 2021
Monthly Analysis
Over the last month, SC initially increased by around 74%, indicating that SC was bullish. However, after failing to break resistance at $0.023, the price started declining and the trend was reversed. A descending wedge pattern has taken shape for Siacoin.

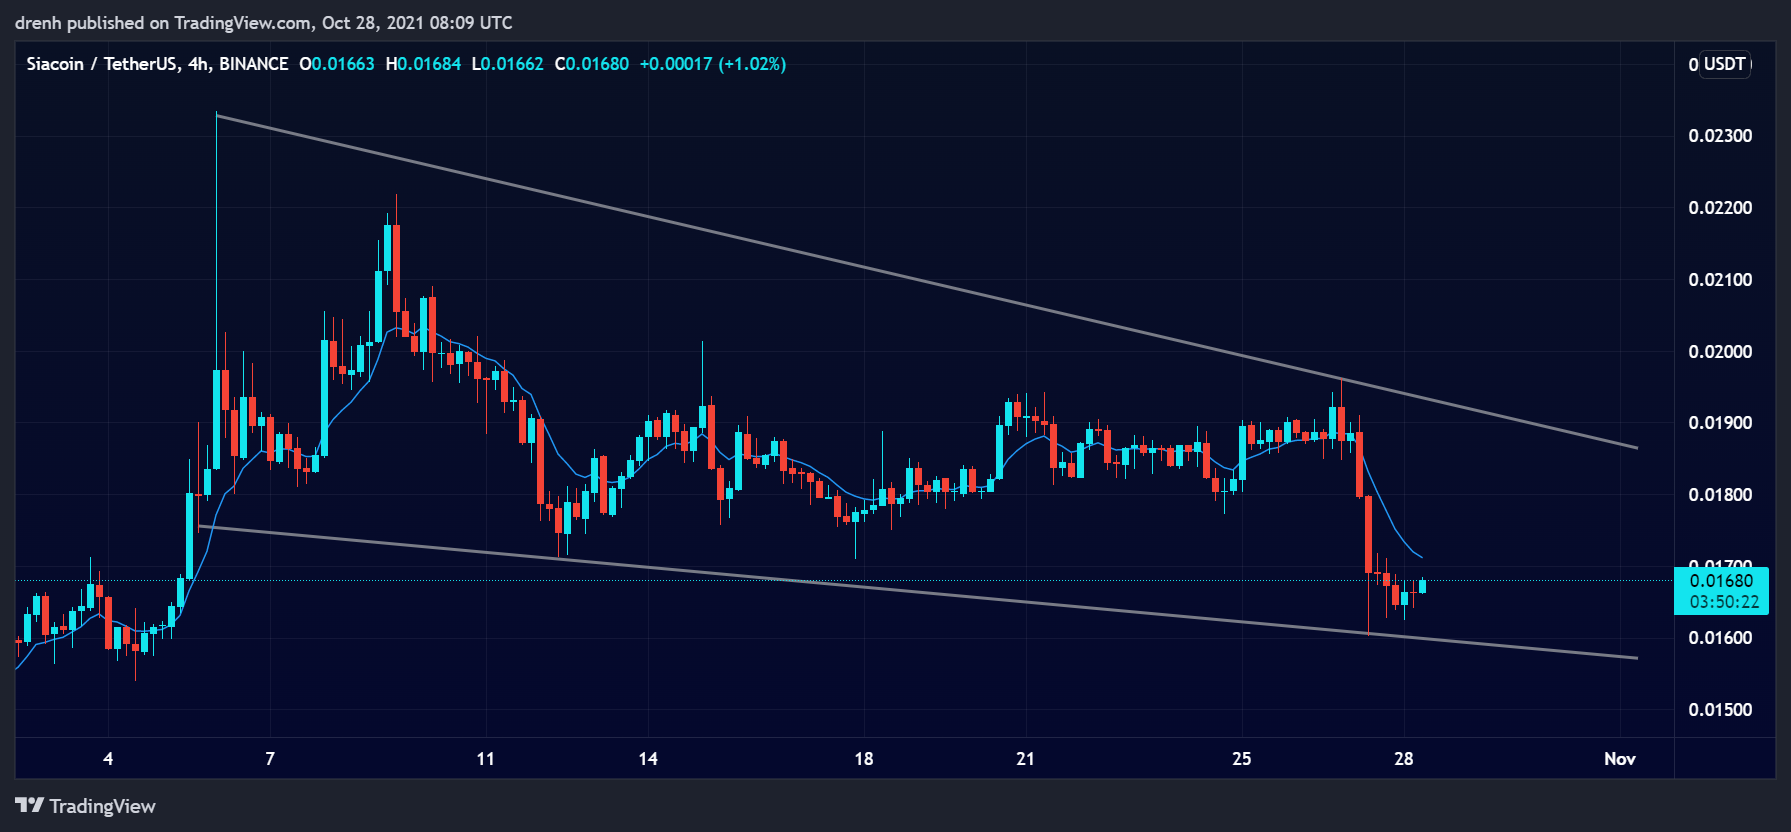
Weekly Analysis
In the last 7 days, SC started increasing again. It increased by around 10%, but it then had a bearish breakout of 18%. This suggests that the trend is bearish and that the price of SC could keep decreasing in the coming days.
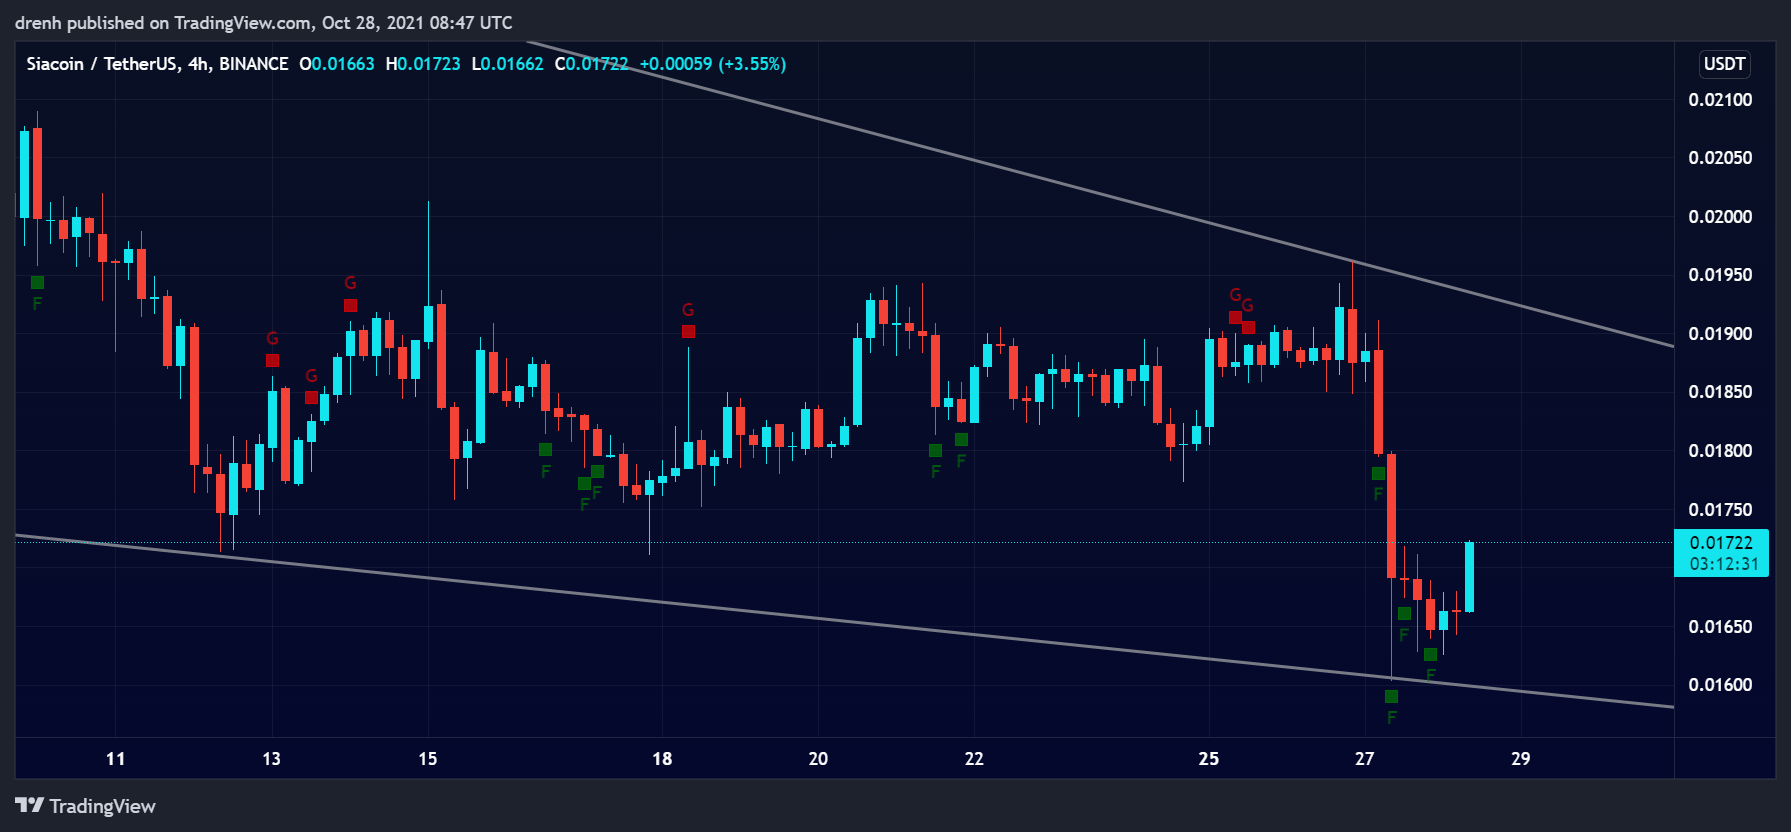
Daily Analysis
In the intraday chart, SC has been bullish. It has increased by more than 6% in the last few hours. While it may find resistance soon, SC could keep increasing in a shorter time frame.
Key Structures
Support
- $0.016
Resistance
- $0.019
Indicators
Moving Average
The 20-day moving average is now above the price due to the recent bearish breakout, indicating that the trend has reversed and that the price of SC could keep declining in the coming days.
The 9-day EMA is also above the price, meaning that the price can decline and that the EMA line can act as resistance to potential upward surges.
Relative Strength Index
The RSI of a 1-day chart has slightly increased recently, but it is still bearish and below 50, meaning that the selling pressure is high. In the 4-hour chart, the RSI was recently in the oversold region, so upward retracement was anticipated.
MACD
The MACD line is below the signal line, indicating that the momentum is bearish and that the price can keep declining in the coming days. Similar can be said about the 4-hour chart, even if the lines have slightly converged recently.
Fear & Greed
The fear and greed indicator of a 4-hour chart suggests that the current emotion of SC traders is fear due to the recent price increase.
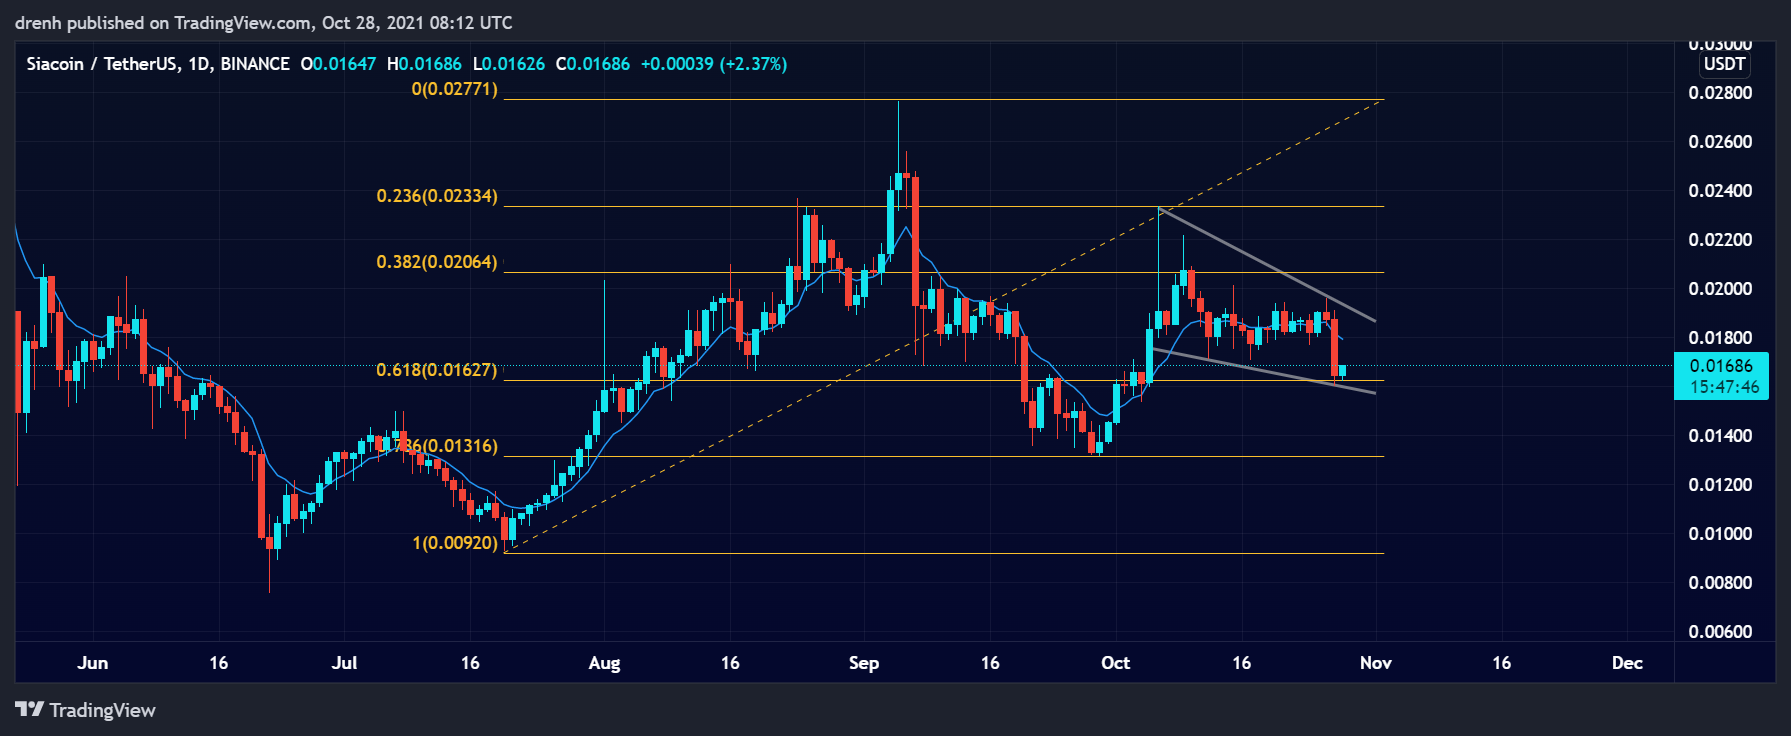
Fibonacci
The Fibonacci retracement levels of a 1-day chart suggest that SC has found support at the 78.6%. Judging by this, SC could increase to 0% in the coming days, even though the price has retraced again recently.

Price Prediction SC – November 2021
Based on this technical analysis, SC can increase close to $0.03 in the coming days if it manages to find support at the projected structures. Furthermore, as the price of BTC increases in the remaining weeks of this quarter, then we can see SC follow that pattern and increase even higher in the coming weeks. SC can reach a new all-time high and even go close to $0.10.
Latest News for SC – Affecting Price
There has not been any major news regarding Siacoin recently. Nonetheless, an upwards surge in the price of BTC that has already been noticed can have a large effect on the price of SC. This could help SC reach a new all-time high in this bull cycle.
Also read: Siacoin (SC) Price Prediction 2021 and Beyond – Is SC a Good Investment?