


SHIB Technical Analysis – February 2022
SHIB hit an all-time high at the end of October, reaching as high as $0.000088, entering the top 10 rankings, and surpassing Dogecoin’s market capitalization for the first time in its history. However, despite the remarkable achievement, the price of SHIB went downhill after that. In the weeks after that, the price kept declining and entered a downtrend. But it was not only SHIB to keep declining at that rate, as the price of BTC started declining as well.
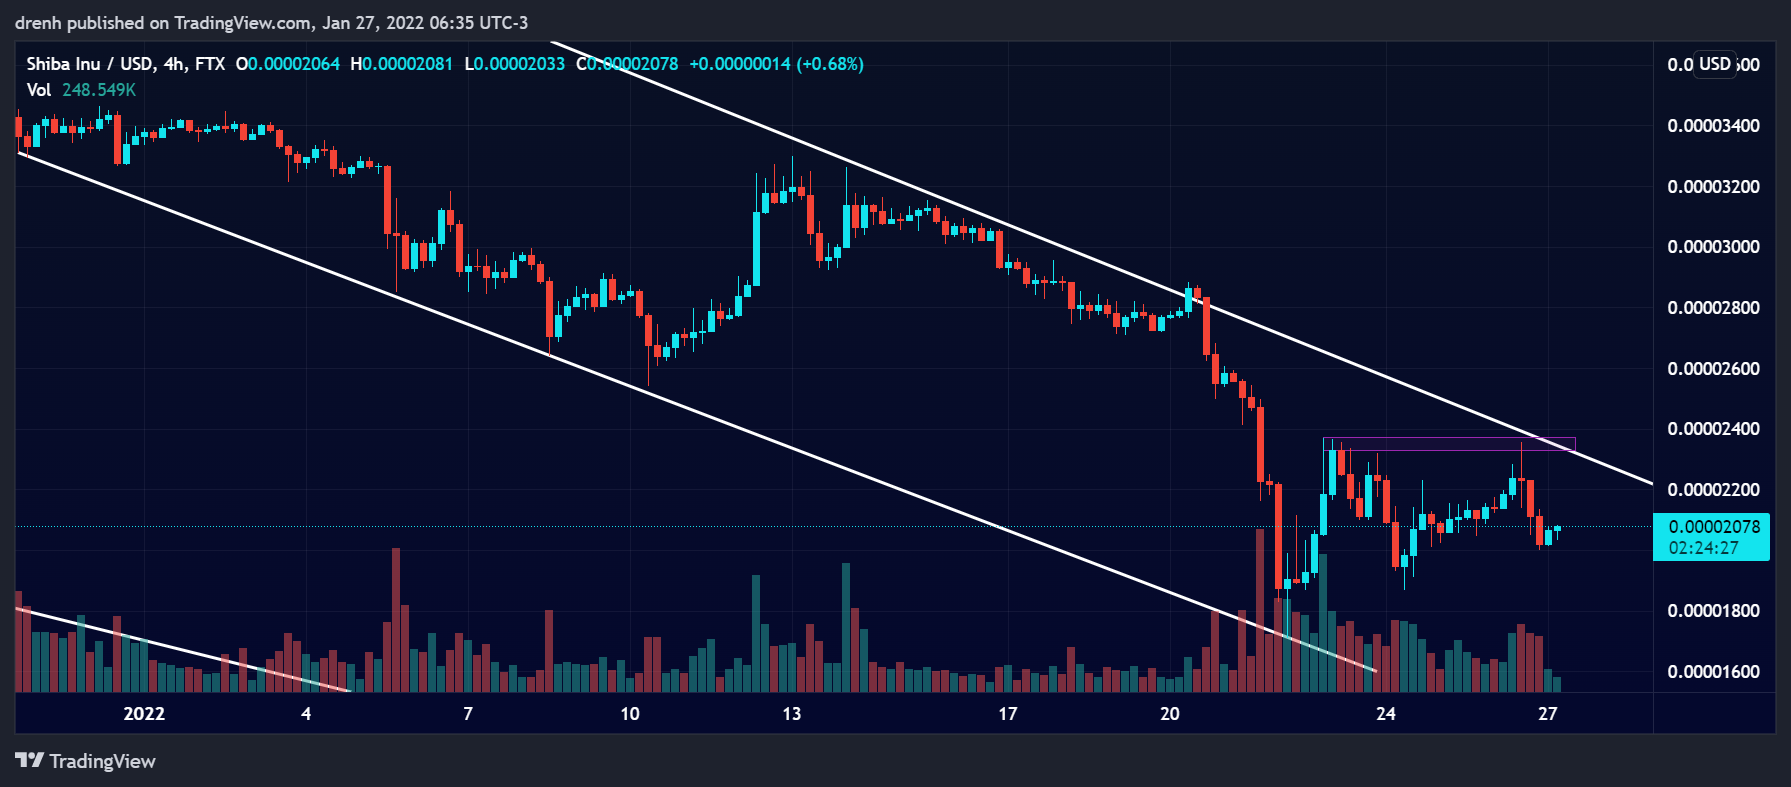
So far, the price of SHIB has declined by around 80% from the all-time high. In just the last two weeks, SHIB has dropped by almost 50%, indicating that this downtrend is continuing and getting more potent as the days pass.
Nonetheless, SHIB has recently found support at $0.000017, and the price is now in correction. It increased by 38% in just a few days, but it failed to beat resistance at $0.000023 twice, meaning that the selling pressure is quite high. Furthermore, the price declined by 15% in the intraday chart, suggesting that SHIB is bearish in the shorter run as well.

Key Structures
Support
- $0.000017
Resistance
- $0.000023
Indicators
Moving Average
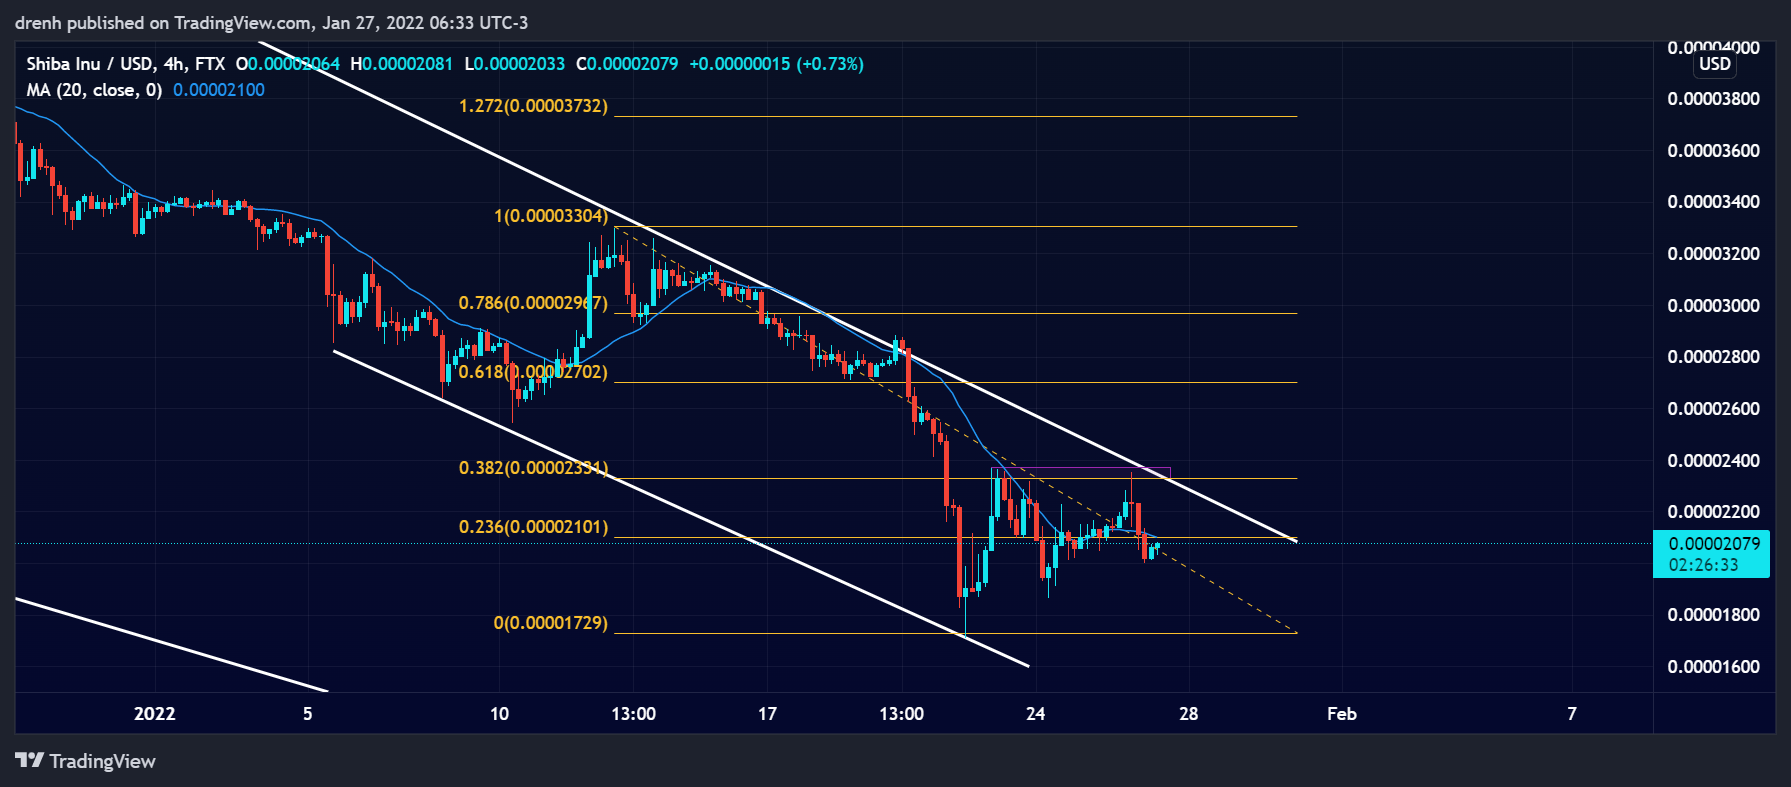
The 20-MA of a 4-hour chart is above the price of SHIB, indicating that the trend is facing downward and that the price of SHIB could keep declining in the coming days.
The 9-EMA of a 4-hour chart is also above the price of SHIB, suggesting that the price of SHIB is bearish in the short run and that the EMA line could resist a sudden increase in the price.
Relative Strength Index
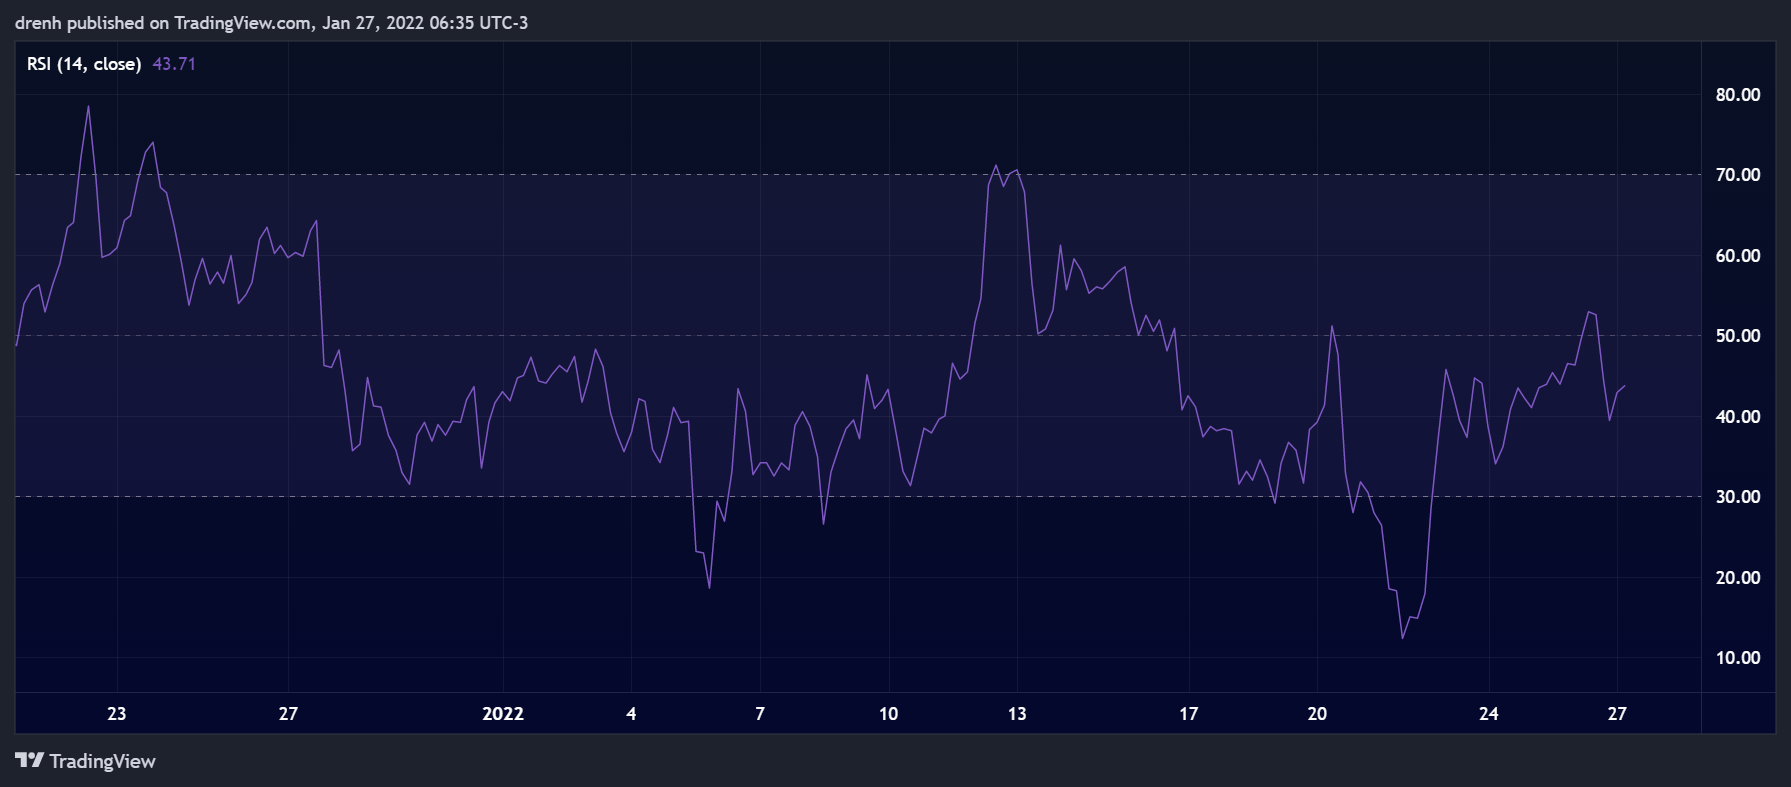
The RSI of a 4-hour chart is slightly bearish but within the 30-70 range. It had recently hit below 30, indicating that SHIB became oversold, therefore leading to a slight increase in the price of SHIB.
MACD
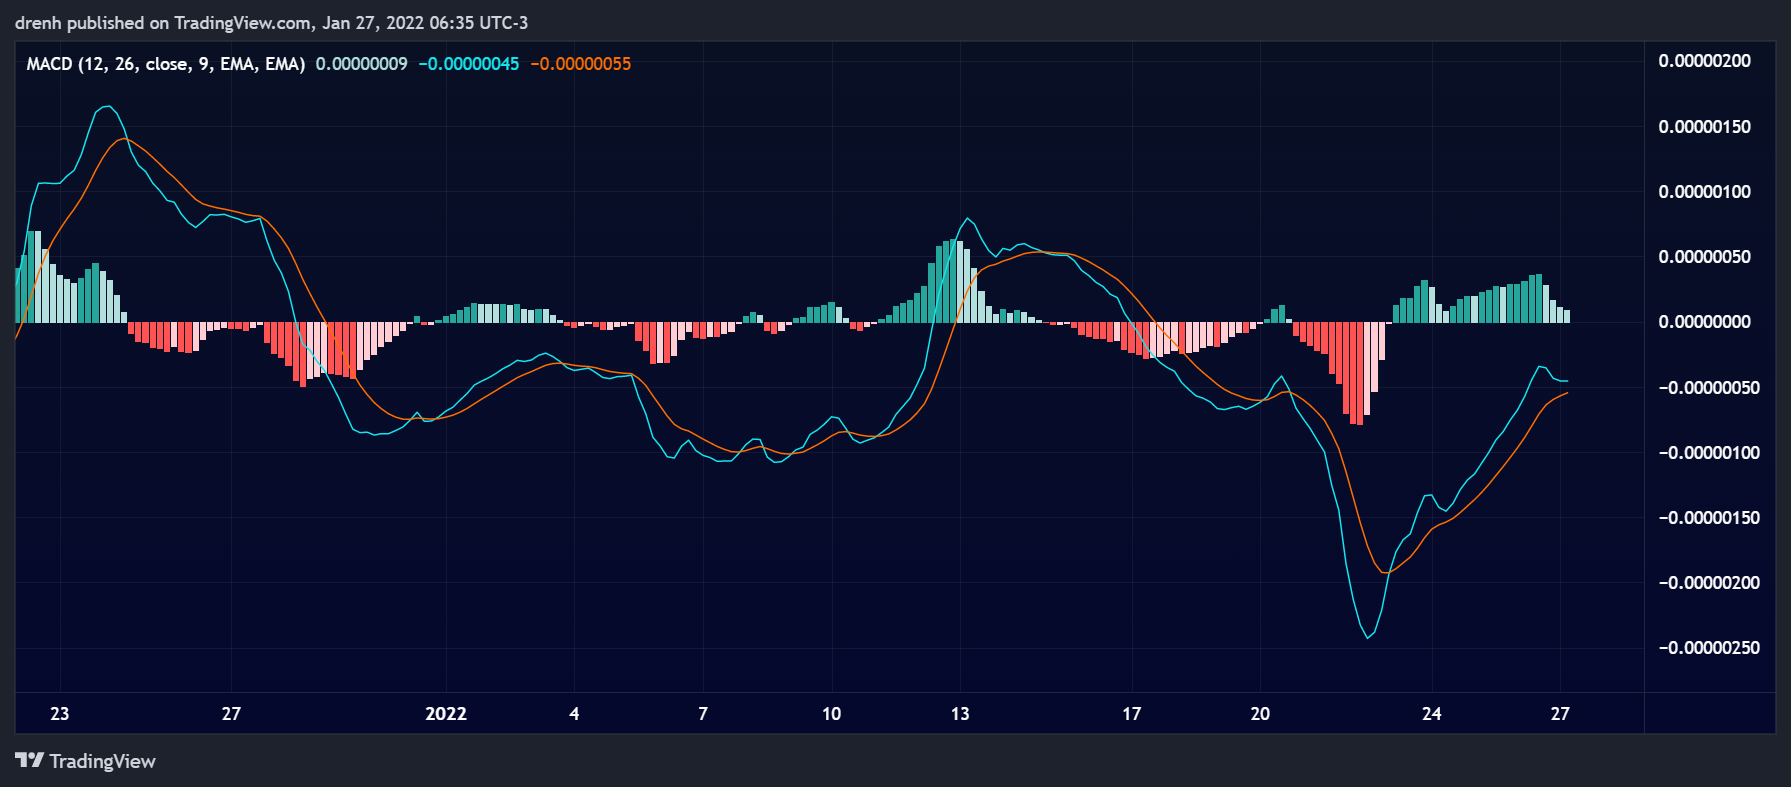
The MACD line of a 4-hour chart is actually above the signal line but beloew the baseline. Even though a bullish momentum was on the build-up, the lines are now converging, meaning that a bearish tendency could remain for SHIB in the coming days.
Fibonacci
The Fibonacci retracement levels of a 4-hour chart suggest that the price of SHIB has recently retraced to the 38.2% level. Since it failed to break that resistance, the price could could close to $0.00001 in the coming days.
Price Prediction SHIB – February 2022
Based on this technical analysis on Shiba Inu (SHIB), the price of SHIB could keep declining in the coming days after failing to surpass $0.000023. Indicators, the trendline, as well as recent price movement of BTC indicate that SHIB could be heading further down in the coming days. Unless SHIB finds support again at $0.000017 and forms a double bottom, there are little to no indicators that suggest a reverse in the trend of Shiba Inu, other things equal.
For more price predictions, check Business Cloud.
Latest News for SHIB – Affecting Price
Mike McGlone, a senior commodity strategist of Bloomberg, has recently stated that while BTC could still rebound in the coming months of 2022, believes that the likes of Dogecoin and Shiba Inu could experience heavy declines in the price, judging by historical price patterns during the internet purge of 2000-2001. Coming from an expert asMcGlone, the statement alone could have a negative implication on the price of SHIB.
On the other hand, whale investors have been holding their SHIB tokens, and recently, the holdings on whale-tier wallets reached $1.2 billion. This shows that even whale investors are willing to hodl and have a bullish perception of SHIB in the coming months.
Moreover, Shiba Inu is also launching its metaverse. As the hype for metaverse-related projects remains high, this could play a role in the price of SHIB throughout 2022. They have recently stated that Shiberse, the Shiba Inu metaverse, is currently in the works and might be imminent of use for SHIB users.
As promised, we are so excited to announce our first special surprise for the year #ShibArmy!
In 2022, we are reaching new heights and welcoming the #Shiberse 🌎. An immersive experience for our ecosystem and the Metaverse space!
We can’t wait to show you more. Woof! 🐶 pic.twitter.com/tCRQ1m1RiT
— Shib (@Shibtoken) January 24, 2022