


SHIB Technical Analysis – December 2021
Monthly Analysis
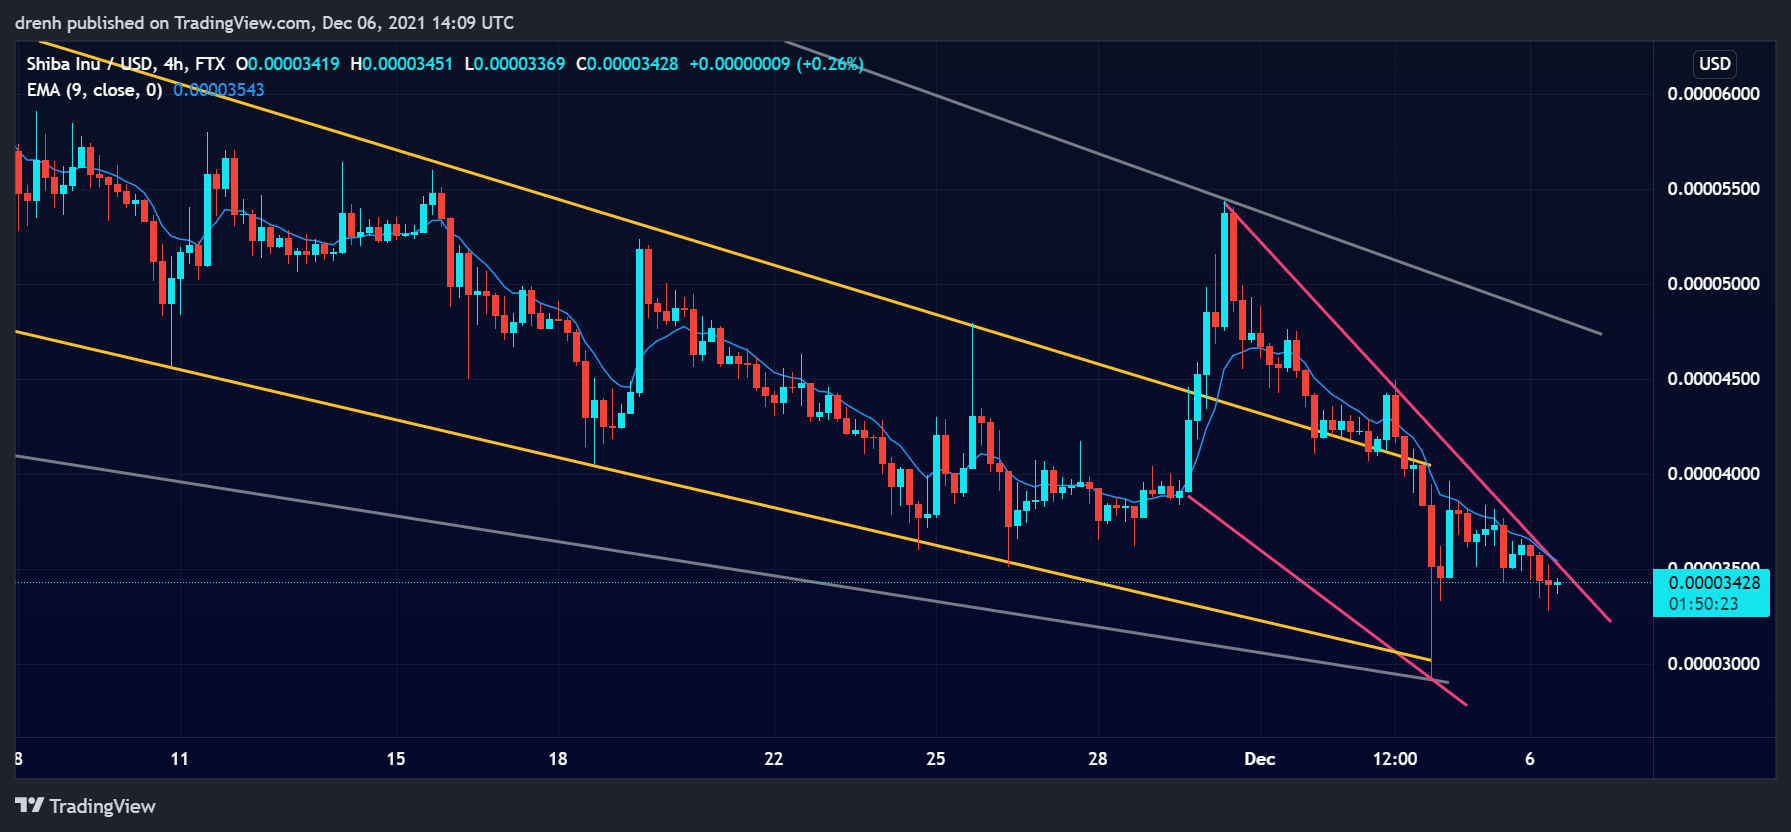
Over the last 30 days, SHIB declined by around 46%. The price found support at $0.00003, and then it surged upwards by 55%. This was a sign that the trend may reverse, but it faced resistance at $0.00005. After that, another bearish breakout of 46% occurred, suggesting that the downtrend continues for SHIB.

Weekly Analysis
In the last 7 days, SHIB has been bearish. The price has declined by around 46%, and it is now in correction. The trend remains downward in a 4-hour chart, and the price could keep declining in the coming days as well.
Daily Analysis
In the intraday chart, SHIB has been bearish as well. The price has declined by 10% in the last few hours, and it is currently facing support after a slight upward impulse. This suggests that the price could keep declining in the coming hours.
Key Structures
Support
- $0.00003
Resistance
- $0.000045
Indicators
Moving Average
The 20-moving average of a 4-hour chart is above the price, indicating that the trend is downward and that SHIB could keep declining in the coming days.
The 9-EMA of a 4-hour chart is also above the price, suggesting that Shiba Inu is bearish and that the EMA line could act as resistance if the price attempts a correction in the short run.
Relative Strength Index
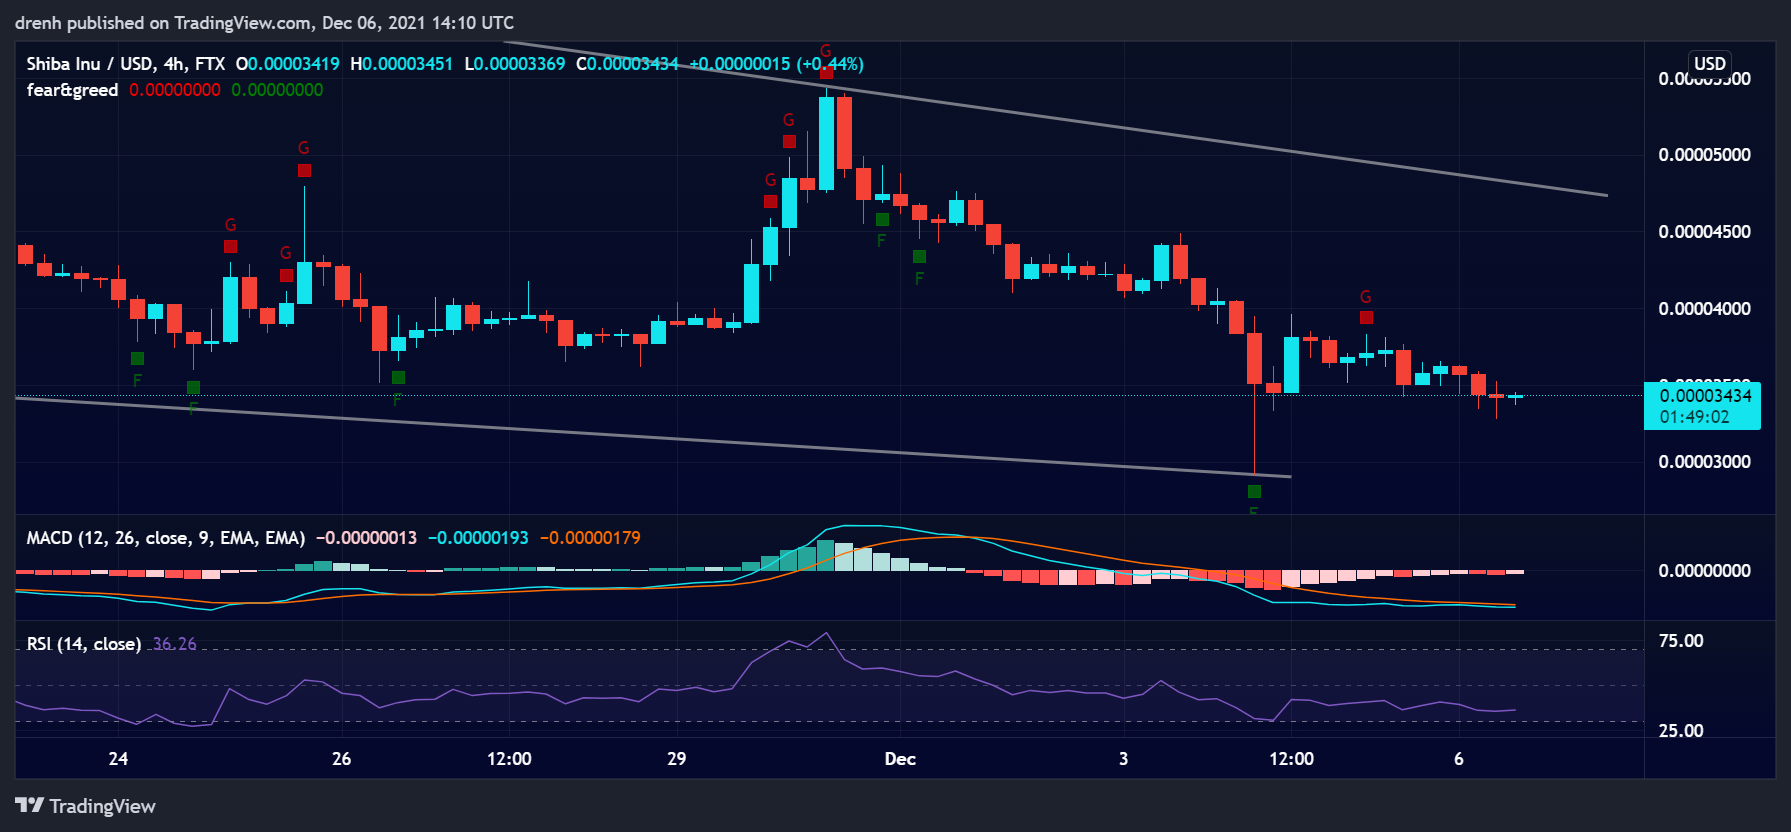
The RSI of a 4-hour chart is close to 30, indicating that SHIB is bearish. However, if the price keeps declining, then SHIB enters the oversold region. That would see SHIB have another impulse upwards until the RSI is within the 30-70 range again.
MACD
The MACD line of a 4-hour chart is slightly above the signal line, indicating that the momentum is bearish for SHIB. Nonetheless, the lines are slowly converging, suggesting that the momentum could shift soon.
Fear & Greed
The fear and greed indicator of a 4-hour chart suggests that the current emotion of SHIB traders is close to greed due to the recent bullish impulse. Nonetheless, this may soon turn into fear as the price continues to decline.
Fibonacci
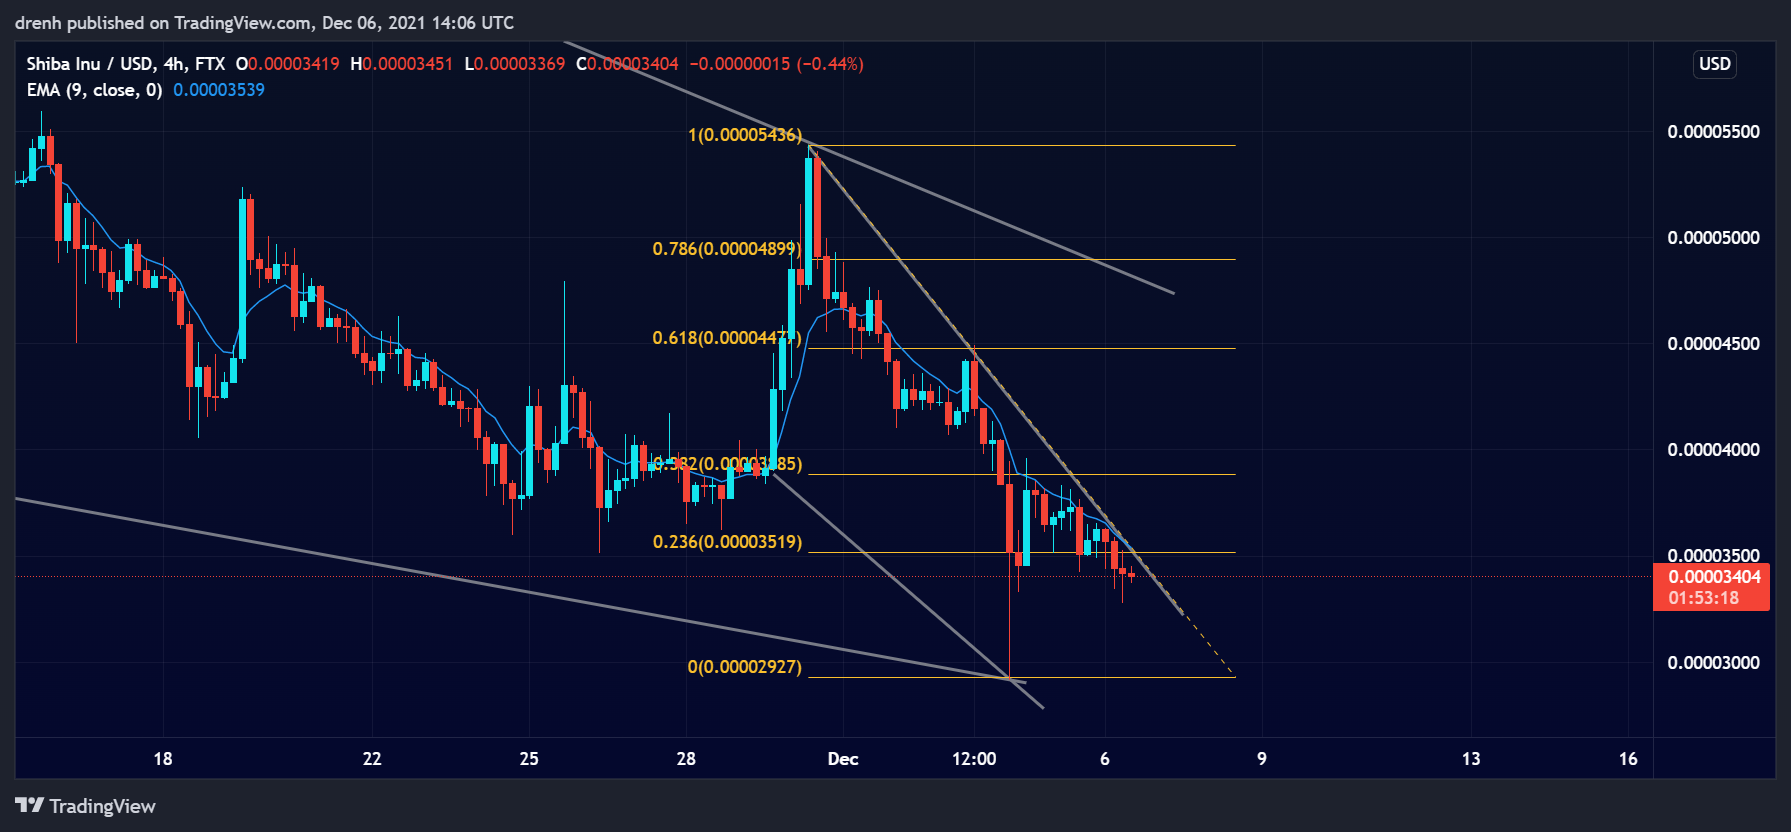
The Fibonacci retracement levels of a 4-hour chart suggest that SHIB retraced to the 38.2% level, and it failed to break resistance there. This could see SHIB go below $0.00003 in the short run.
Price Prediction SHIB – December 2021
Based on this technical analysis on Shiba Inu (SHIB), the price could keep declining in the short run. If the price fails to find support at $0.00003, then SHIB could even go below $0.00002. If it finds support in that area, then SHIB may have another chance to reverse, other things equal. On a bullish note, SHIB could also increase if the bull cycle has another leg, as many experts predict. With the hype around meme-influenced coins remaining high, then SHIb could eventually reach new highs.
Latest News for SHIB – Affecting Price
Shiba Inu‘s mysterious founder has recently announced that more SHIB tokens are planned to be burned in the coming weeks. Furthermore, Shiba Inu is also working on its own metaverse. This could greatly affect SHIB and its price in the longer run.
Also read:
Shiba Inu (SHIB) Price Prediction 2022 and Beyond – Can SHIB Hit $1?
Is Akita Same as Shiba Inu – A Detailed Comparison Between the Two Meme-Coins
Floki Inu vs. Shiba Inu – Differences and Similarities
Dogecoin vs. SHIBA INU – Battle of the Memecoins