


RUNE Technical Analysis – October 2021
Monthly Analysis
In the last 30 days, RUNE initially increased by 48%, but it was then stopped at $9.30. After that, the price started decreasing and dropped by 26%. After that, the price started increasing again. RUNE is now in an uptrend, and its price may keep increasing in the coming days.
Weekly Analysis
In the last 7 days, RUNE has been extremely bullish. Its price has increased by 127% in just the last few days. It faced resistance at $15.76, but its price is still quite bullish. Recently, the price of RUNE has been retracing.

Daily Analysis
In the intraday chart, RUNE has been bearish. Its price has dropped by around 10% only today. This suggests that the trend for the shorter run is downward and that its price can decrease in the coming hours.
Key Structures
Support
- $10.5
Resistance
- $15.76
Indicators
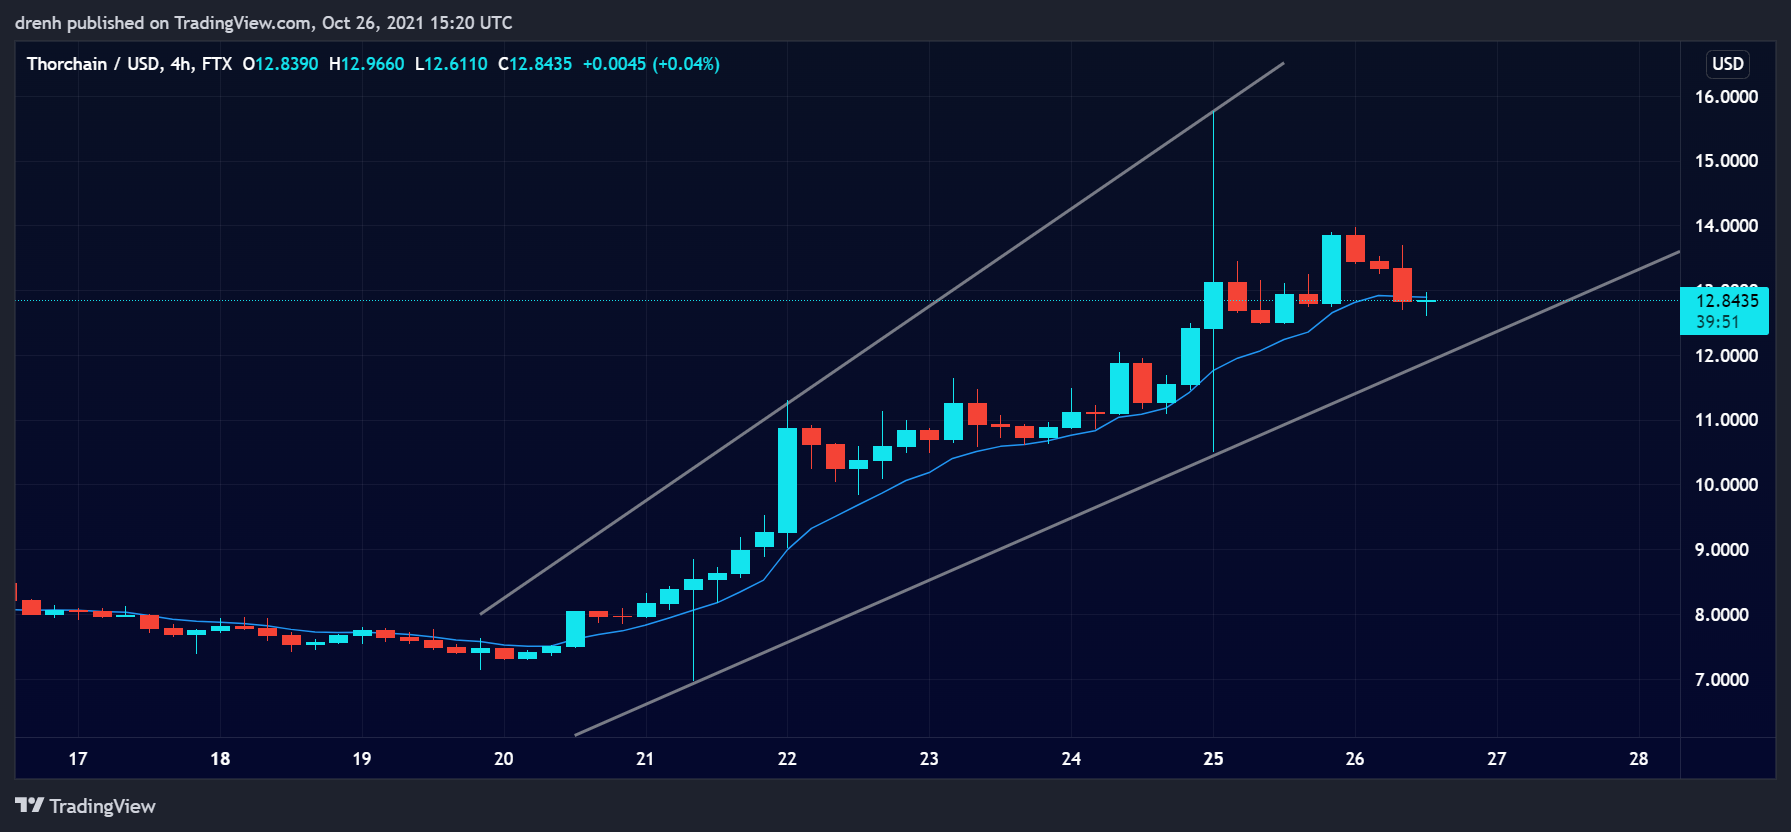
Moving Average
The 20-day moving average is quite below the price, indicating that RUNE is quite bullish and that the trend is facing upwards. This suggests that the price of RUNE may increase in the coming days.
The 9-day EMA is also below the price, indicating bullish tendencies. It may act as support if the price retraces further down.
Relative Strength Index
The RSI of a daily chart was recently at around 80, meaning that RUNE became overbought. Therefore, the recent pullback was inevitable and anticipated. It is still at 70, so the price of RUNE might retrace further down. In the 4-hour chart, it is less bullish, meaning that there is room for growth in the coming hours.
MACD
In the 1-day chart, the MACD line is quite above the signal line and above the baseline. This indicates that the momentum is bullish and that the price can keep increasing. However, in a 4-hour chart, the MACD line has recently moved below the signal line, indicating that the momentum is now bearish in the shorter run.
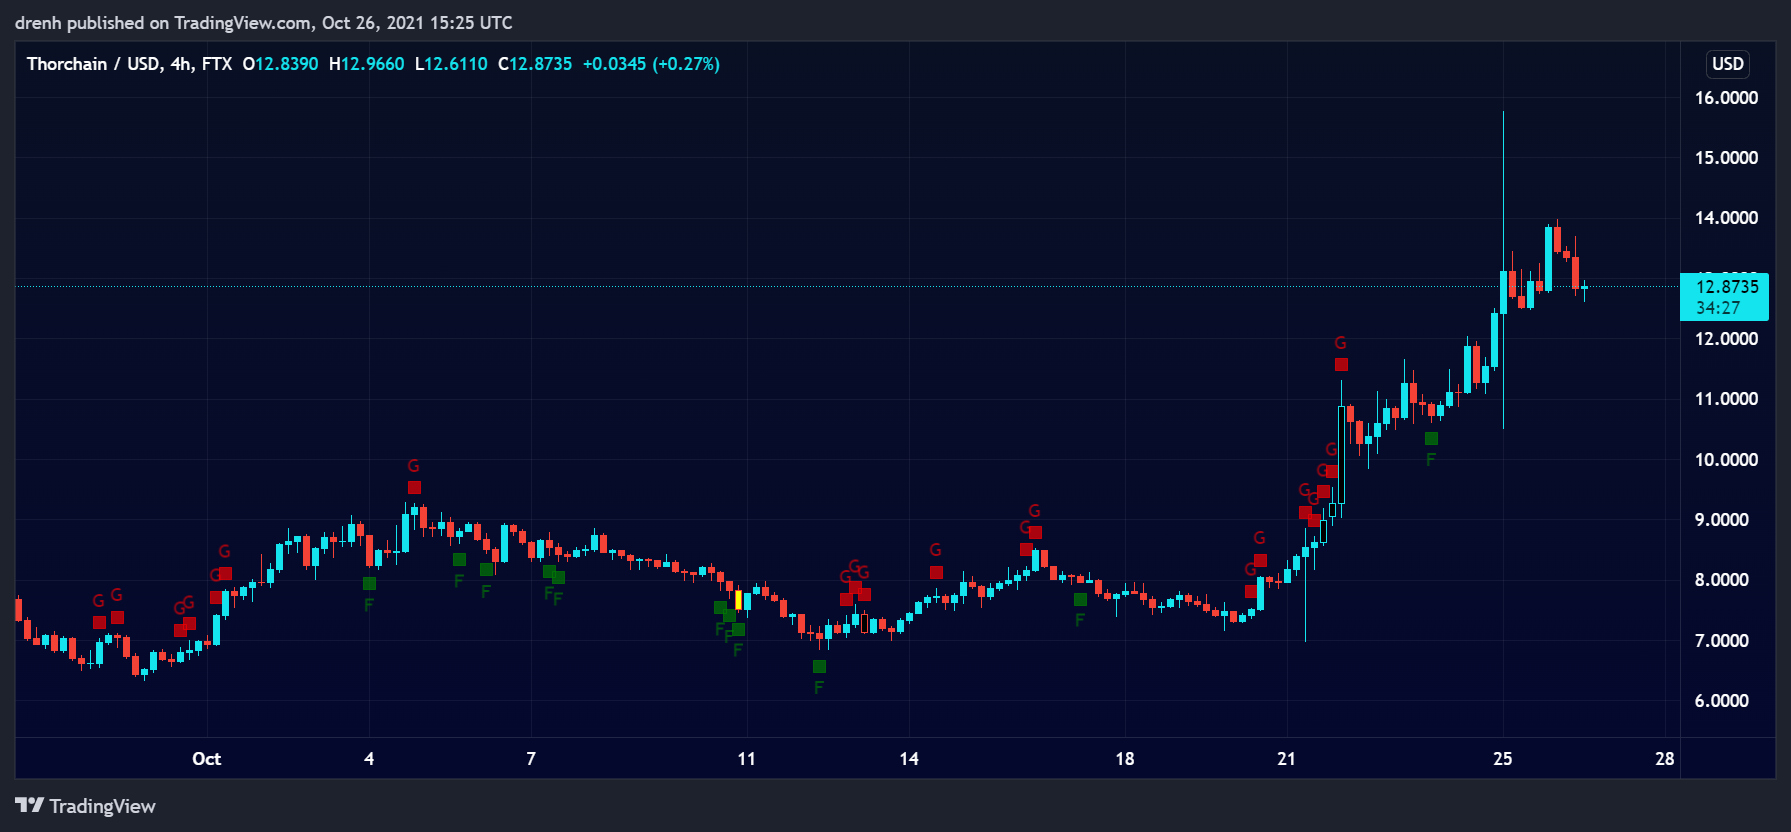
Fear & Greed
The fear and greed indicator of a 4-hour chart suggests that the current emotion of RUNE was recently fear, which then led to investors buying on the fear zone.
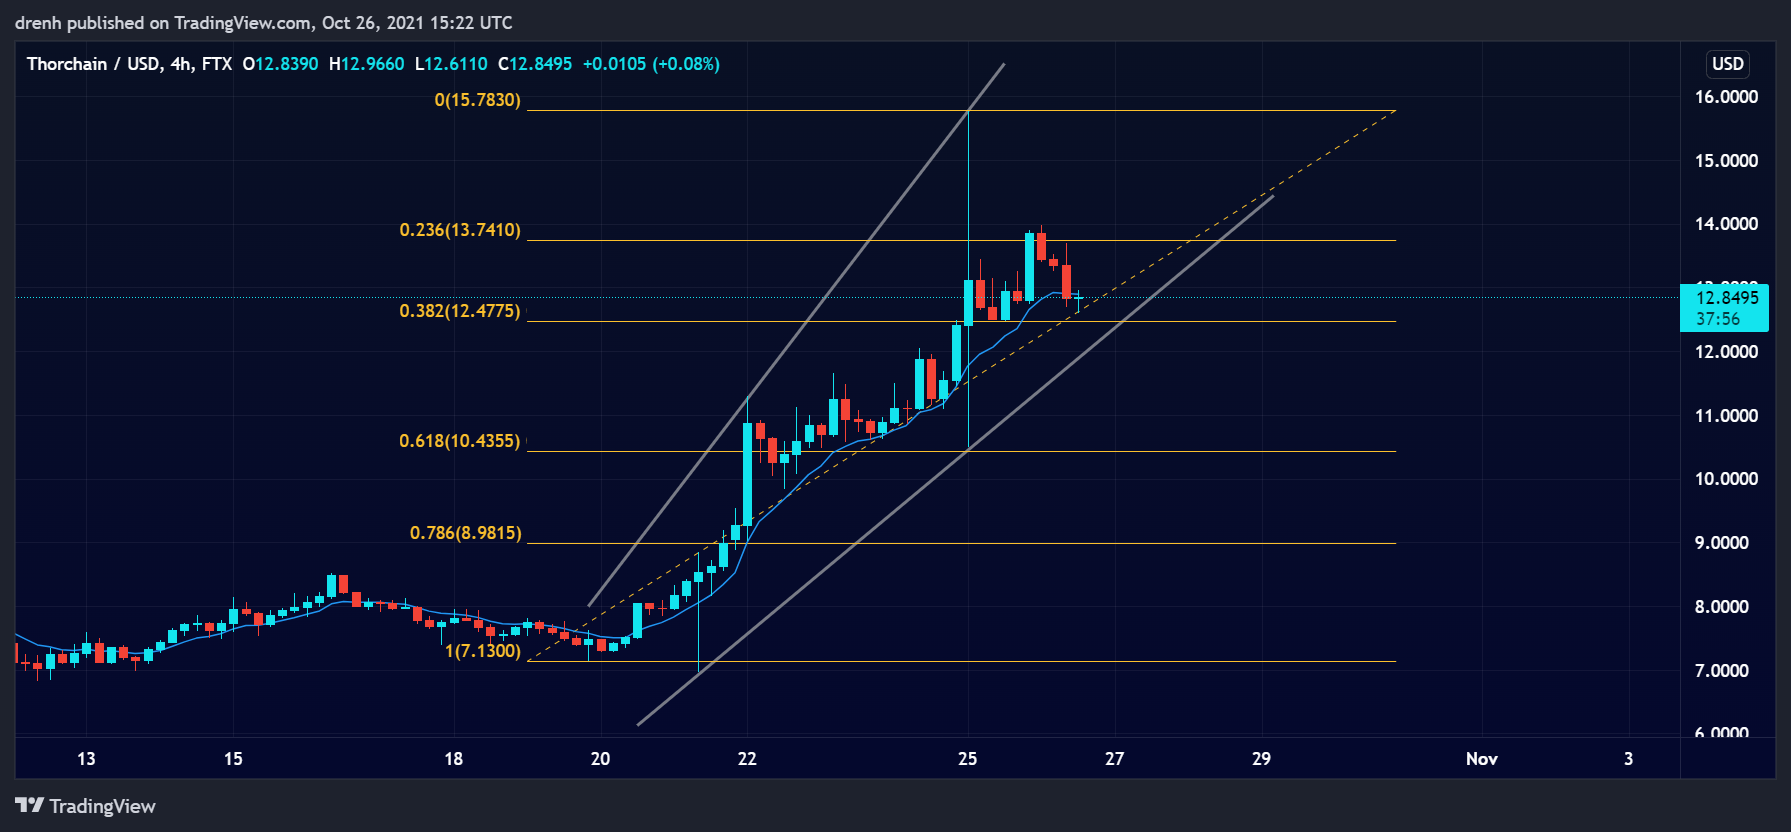
Fibonacci
The Fibonacci retracement levels suggest that RUNE could soon find support at one of the levels. It is currently testing the 38.2% level, but the 61.8% might prove to be a stronger support zone.
Price Prediction RUNE – October 2021
Based on this technical analysis on RUNE, its price may increase up to $18 in the short run if it finds support at the projected structures. Furthermore, if BTC keeps its pace for the remainder of this quarter, then we could eventually see RUNE reach a new all-time high and even go close to $30.
Latest News for RUNE – Affecting Price
Some ETH-based pools were recently reactivated, and this was the primary cause of THORChain’s recent price surge. The price may keep increasing at such rates in the coming days as well.
Also read: THORChain (RUNE) Price Prediction – What are the Forecasts for the RUNE Price in 2021 and Beyond?