


XRP Technical Analysis – October 2021
Monthly Analysis
In the last 30 days, XRP decreased by around 39%. This decrease was then supported at $0.85. After that, XRP started increasing again, and it had high highs and higher lows in a 40hour chart, indicating an uptrend.
Weekly Analysis
In just the last 7 days, XRP increased by 22%. XRP was then resisted at $1.08 as the selling pressure became higher. In the shorter run, XRP is still bullish and could attempt to retest resistance at $1.08.
Daily Analysis
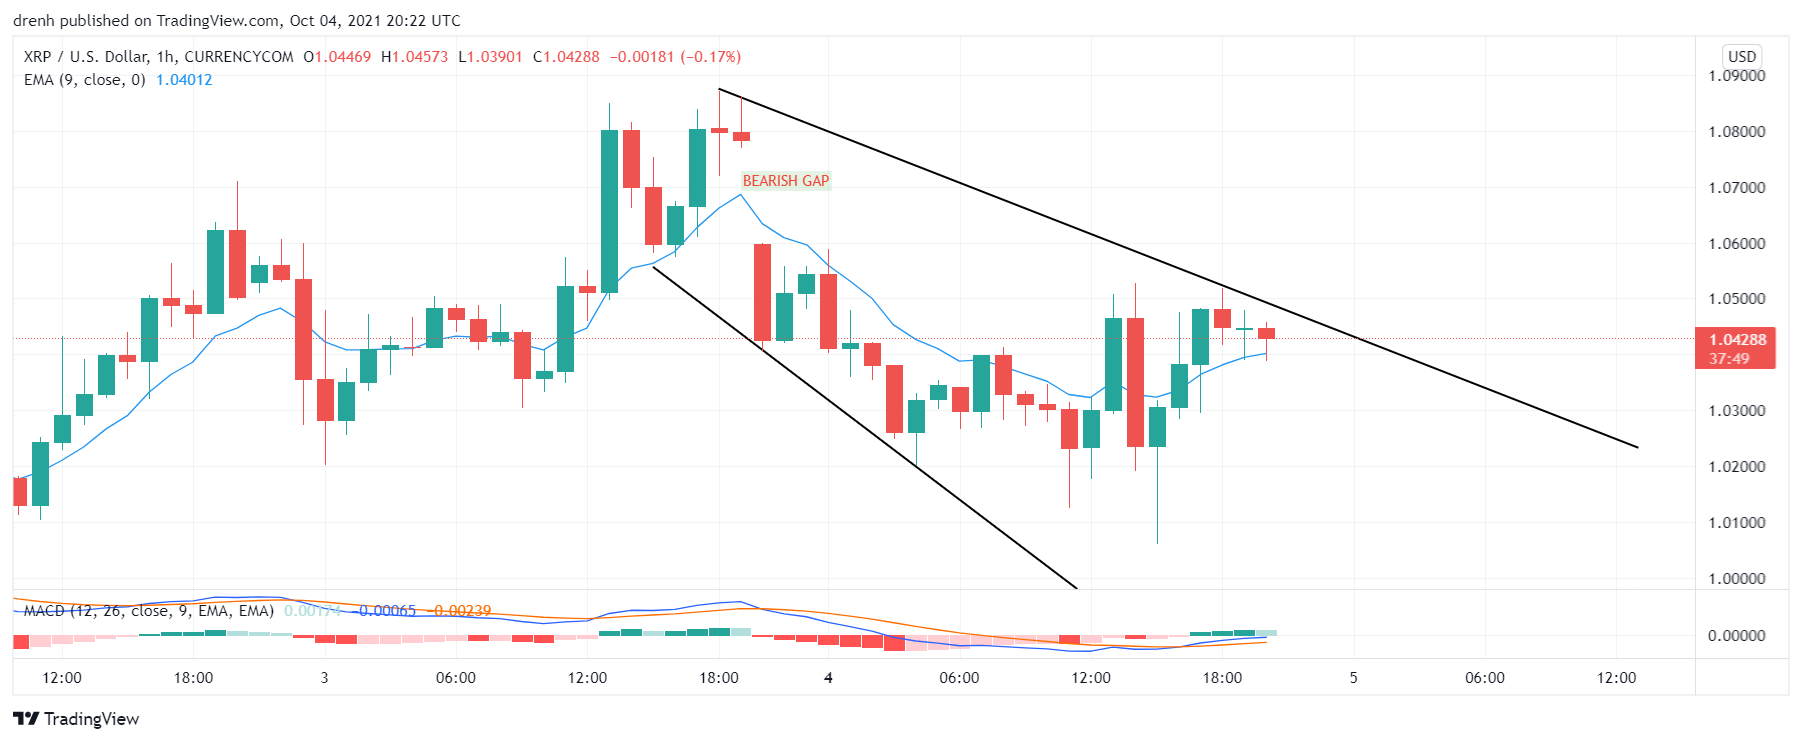
In an intraday chart, XRP has been bearish as the price has declined by 7%. This noticeable decline could also be seen from the bearish gap formed in the 1-hour chart.

Key Structures
Support
- $1
Resistance
- $1.08
Indicators
Moving Average
The 20-day moving average is now below the price due to the recent price increase, meaning that the trend could now be upward and that the price could keep increasing in the coming days.
The 9-day EMA is also below the price and is currently acting as support for XRP. It also indicates a bullish momentum for XRP.
Relative Strength Index
The RSI has slightly declined in a daily chart, but it is still above 50, meaning that the momentum is bullish. As for the 4-hour chart, it is above 50 now since it was in the overbought region before the recent pullback.
MACD
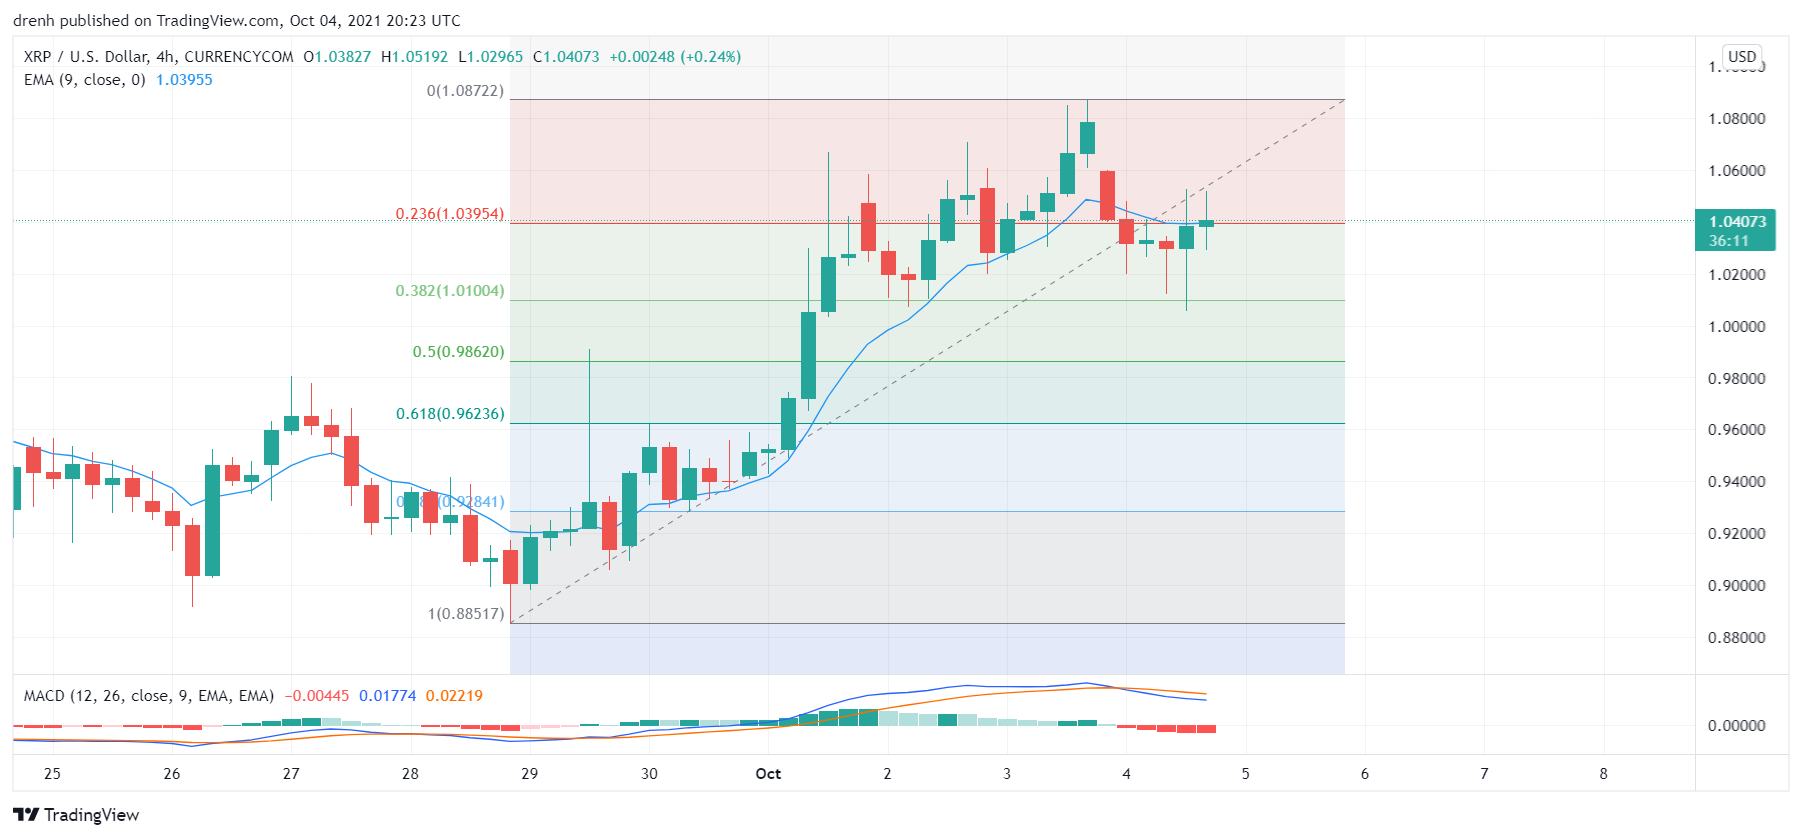
The MACD line is above the signal line and now headed above the baseline, meaning that the momentum is bullish. In a 4-hour chart, the MACD line is below the signal line and now headed below the baseline, meaning that the shorter-term momentum is bearish.
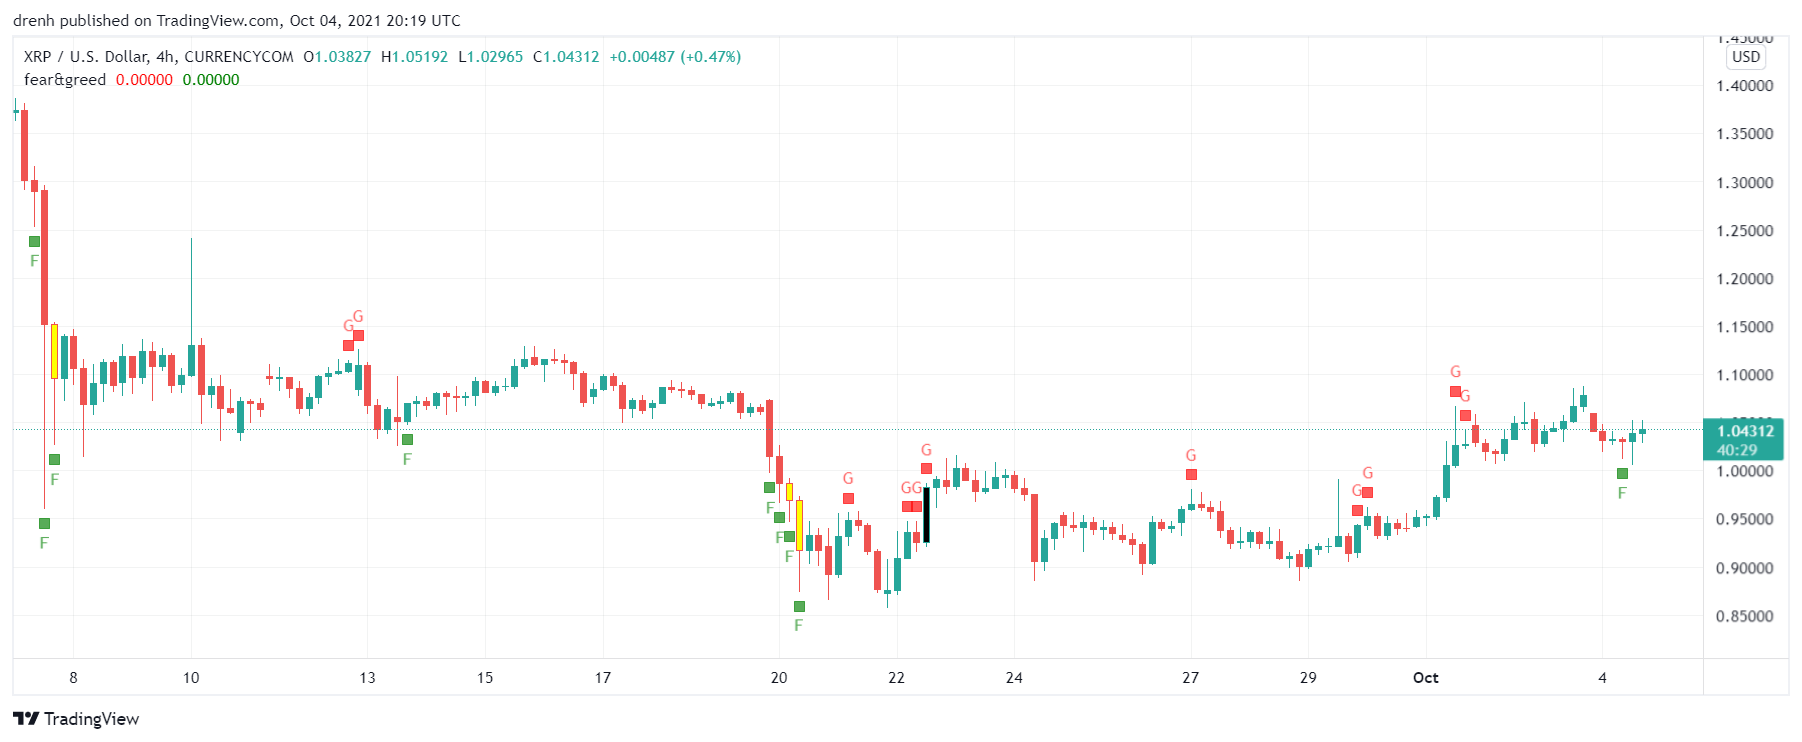
Fear & Greed
The fear and greed indicator suggests that the current emotion for XRP traders in a 4-hour chart is fear.
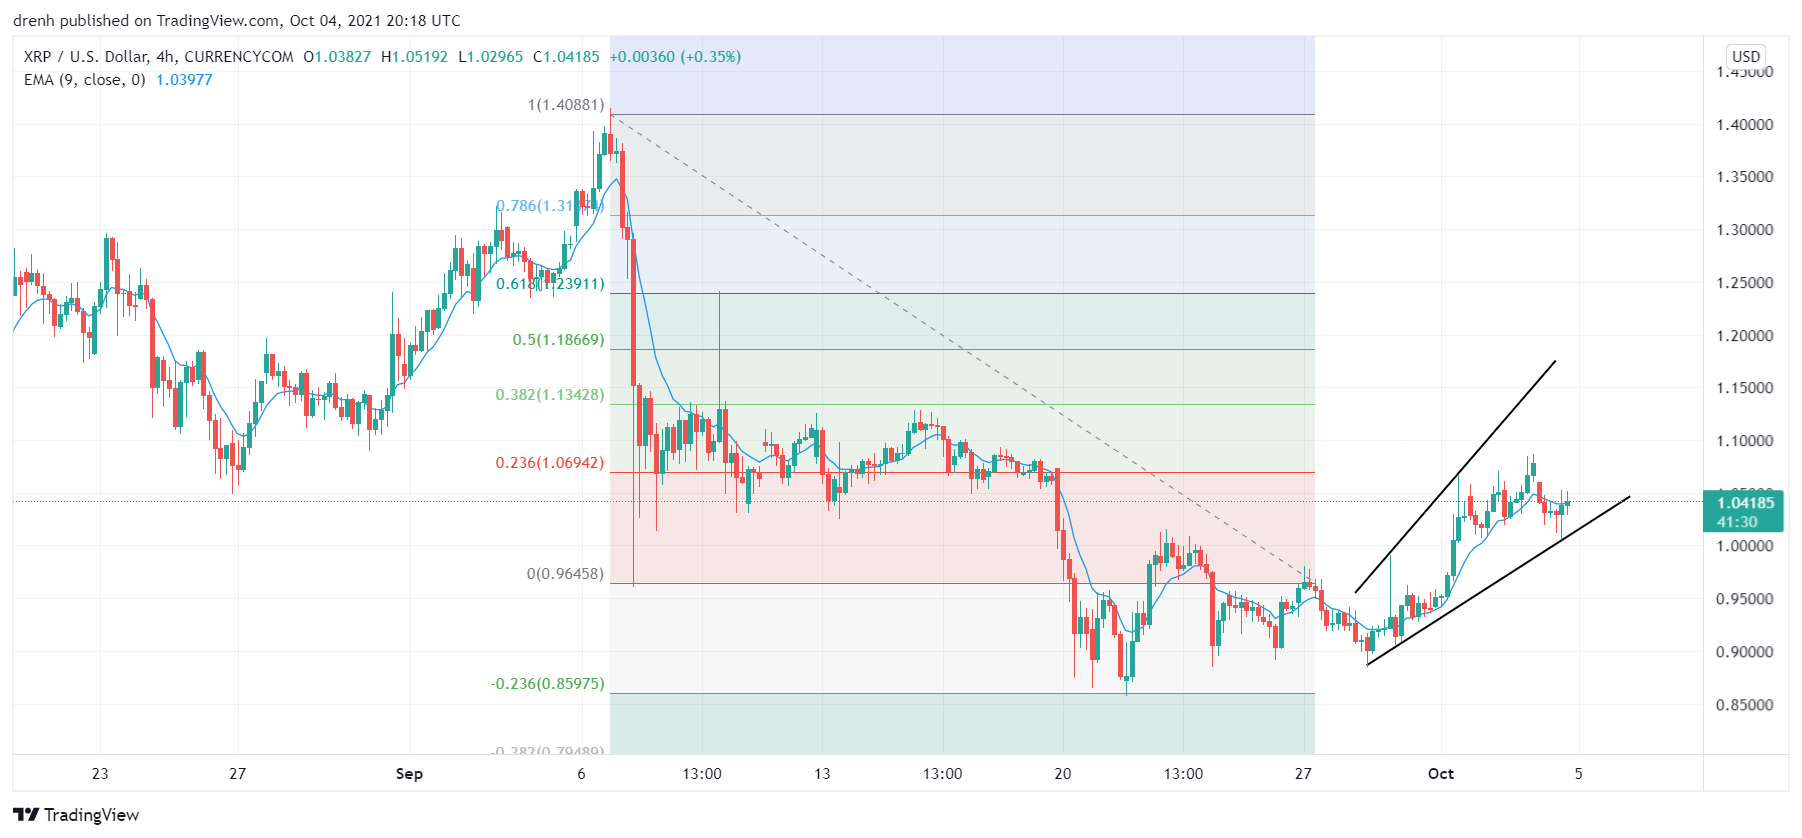
Fibonacci
The Fibonacci retracement levels in the price movement over the last 30 days suggest that the price initially retraced at 61.8%. Then, the price went to the 23.6% Fibonacci extension level and found support there.

In a 4-hour chart, the price of XRP retraced and found support at 38.2%, meaning that the price could potentially go to one of the extension levels.
Price Prediction XRP – October 2021
Based on this technical analysis on XRP, we could see its price increase in the coming hours and retest resistance at $1.08. If resistance is broken, XRP could initially go to $1.13 before attempting to reach $1.25, other things equal. However, if the new high ends to be lower than the previous high, that could be one of the first signs that the trend is reversing and that the price might decline.
Latest News for XRP – Affecting Price
The Ripple case from the SEC lawsuit has been taking longer than initially anticipated. This has had an adverse effect on XRP so far. Recently, the judge has allowed that XRP holders (HODLers) can now appear in court to be of assistance.
Also read: Ripple Price Prediction 2021 – Will the XRP Price Explode After the Issue with SEC is Resolved?