


MATIC Technical Analysis – February 2022
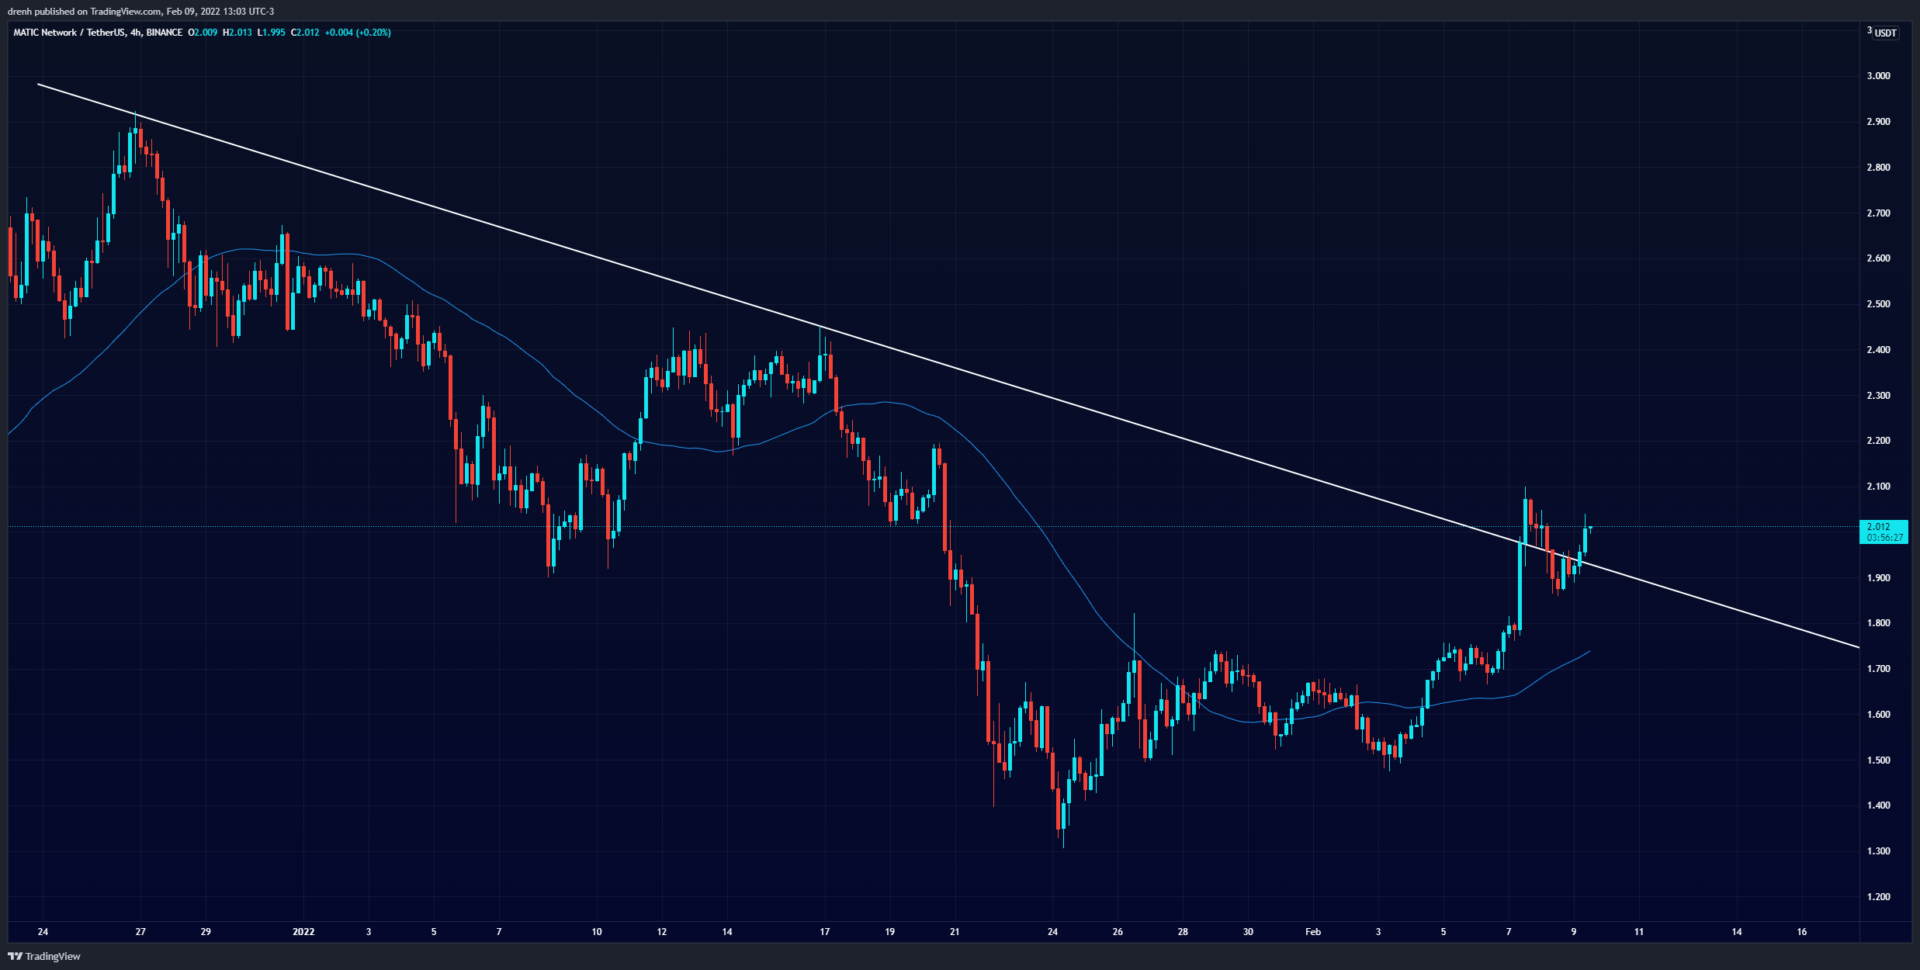
Polygon (MATIC) reached its all-time high in late December at a price of $2.92. After that, the price entered a bearish run. The price declined by around 35% initially, but it found support at $1.90. The price had a correction and faced resistance at $2.45 twice, and then it kept declining in the following weeks.
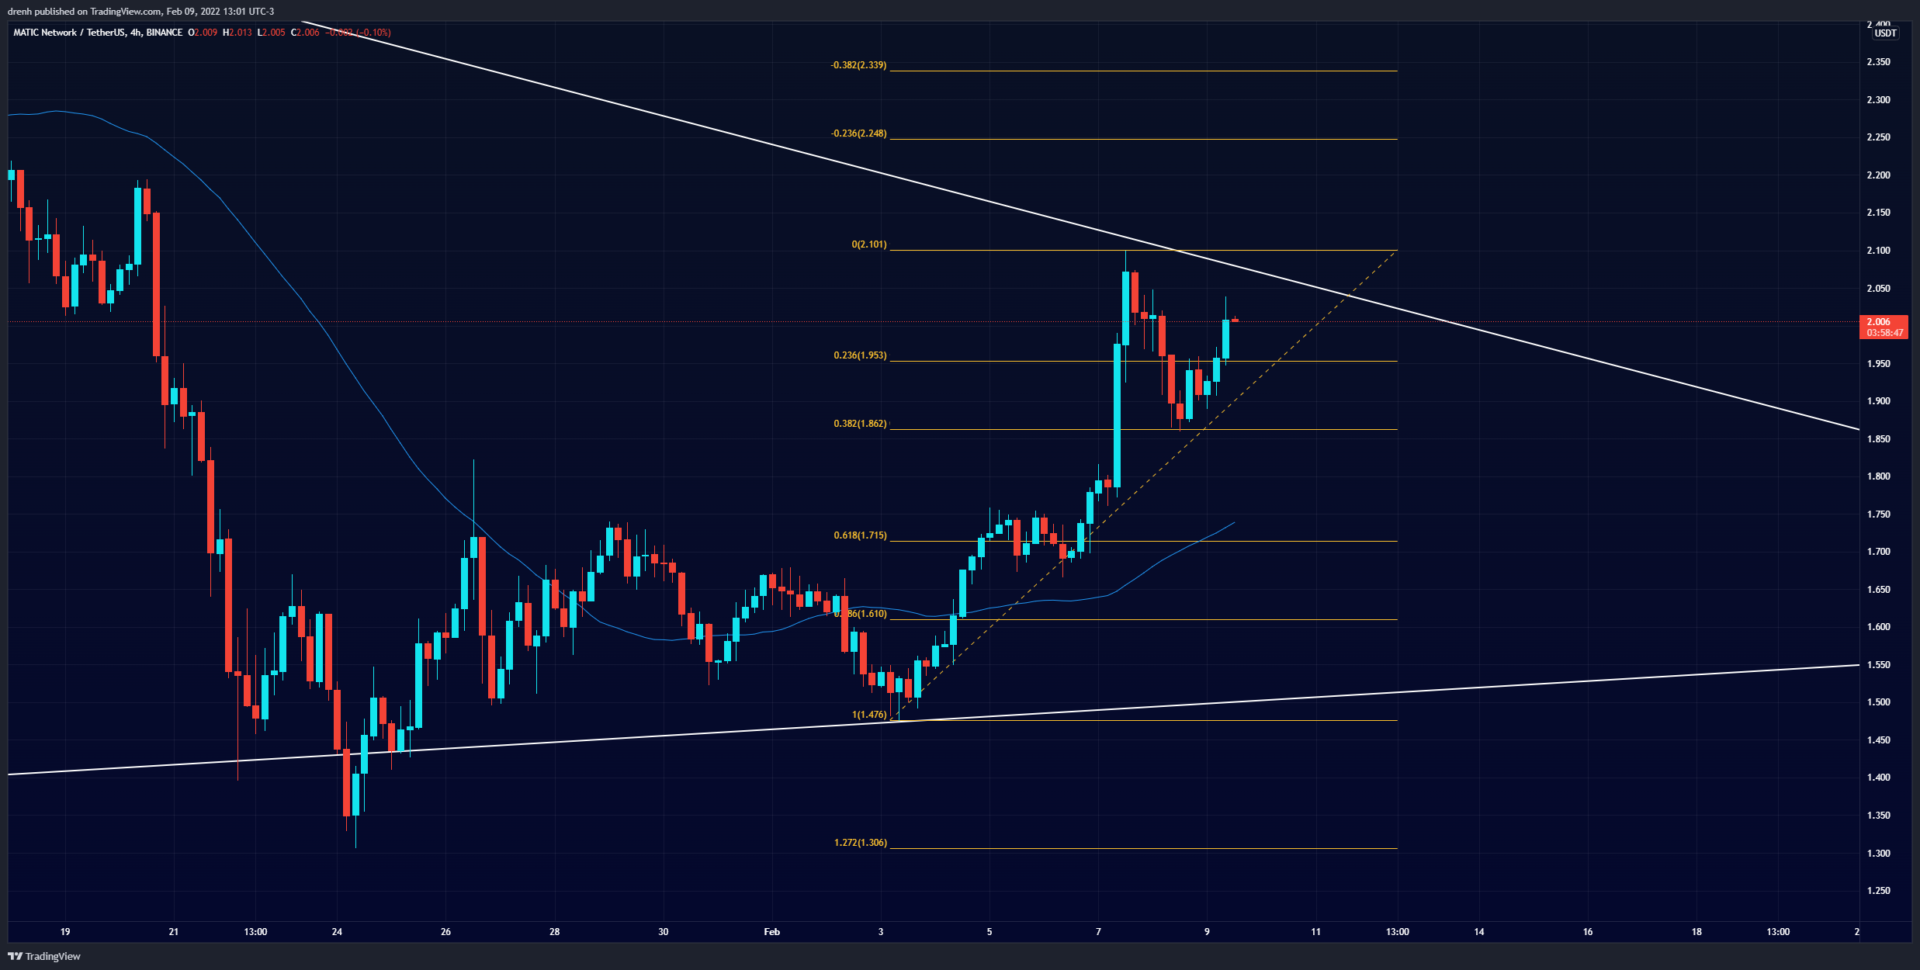
MATIC found support at $1.30 on the 24th of January, and it has been on the rise ever since. The price has increased by more than 60% in the last couple of weeks. The price recently faced resistance at $2.10. After a retracement of 11%, the price is now on the rise once again.
MATIC is still bearish when looking at the 4-hour chart from the moment it hit its all-time high. Nonetheless, the trendline was recently broken, indicating that MATIC could be aiming for a reversal soon.

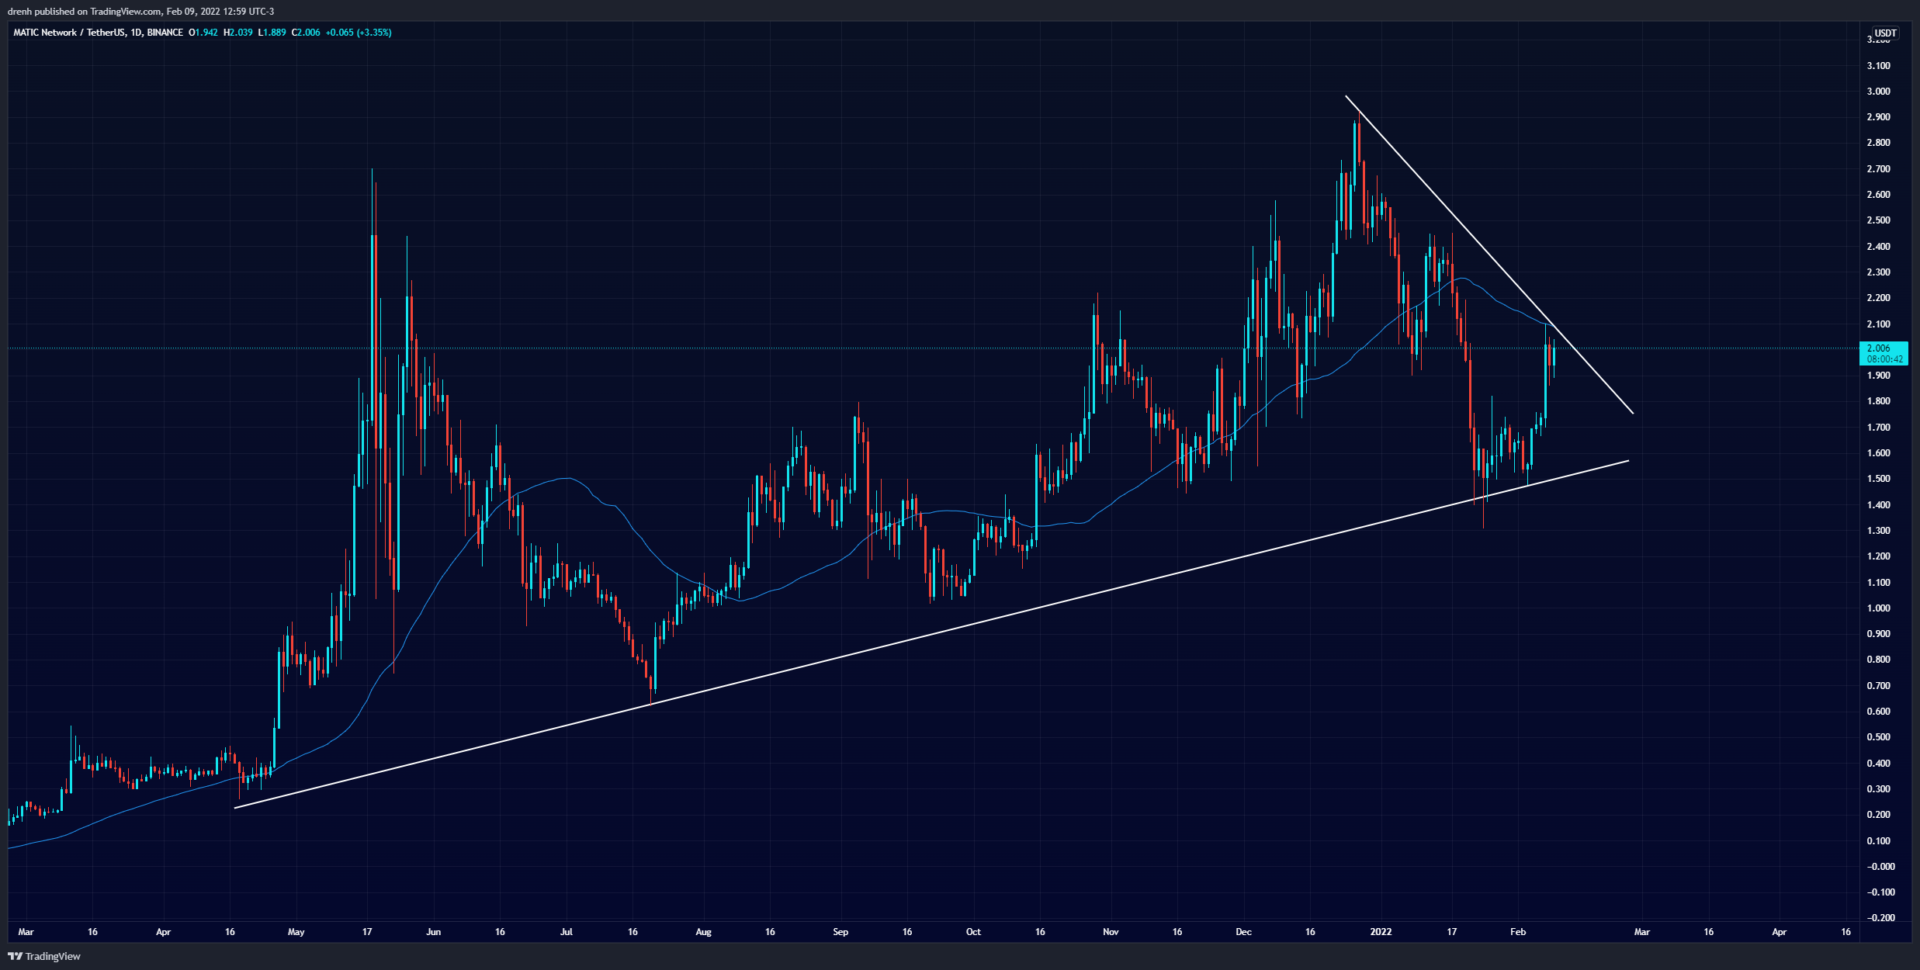
However, looking at the longer term, MATIC is still bullish. When looking at the 1-day chart, the trendline has supported the price numerous times, despite the candlestick wicks temporarily going below the trendline. The recent price movement of MATIC in the 1-day chart shows a triangle pattern forming, which usually indicates a breakout in the coming weeks. Hence, the trend reversal could as well occur for MATIC, other things equal.
Key Structures
Support
- $1.85
Resistance
- $2.10
Indicators
Moving Average
Both the 50-MA and the 20-MA of a 4-hour chart are currently below the price of MATIC, indicating that the trend may now face upward and that the price of MATIC could keep increasing in the coming weeks.
The 9-EMA of a 4-hour chart is also currently below the price, indicating that the price could keep increasing in the short run and that the EMA line could support the price of MATIC.
Relative Strength Index
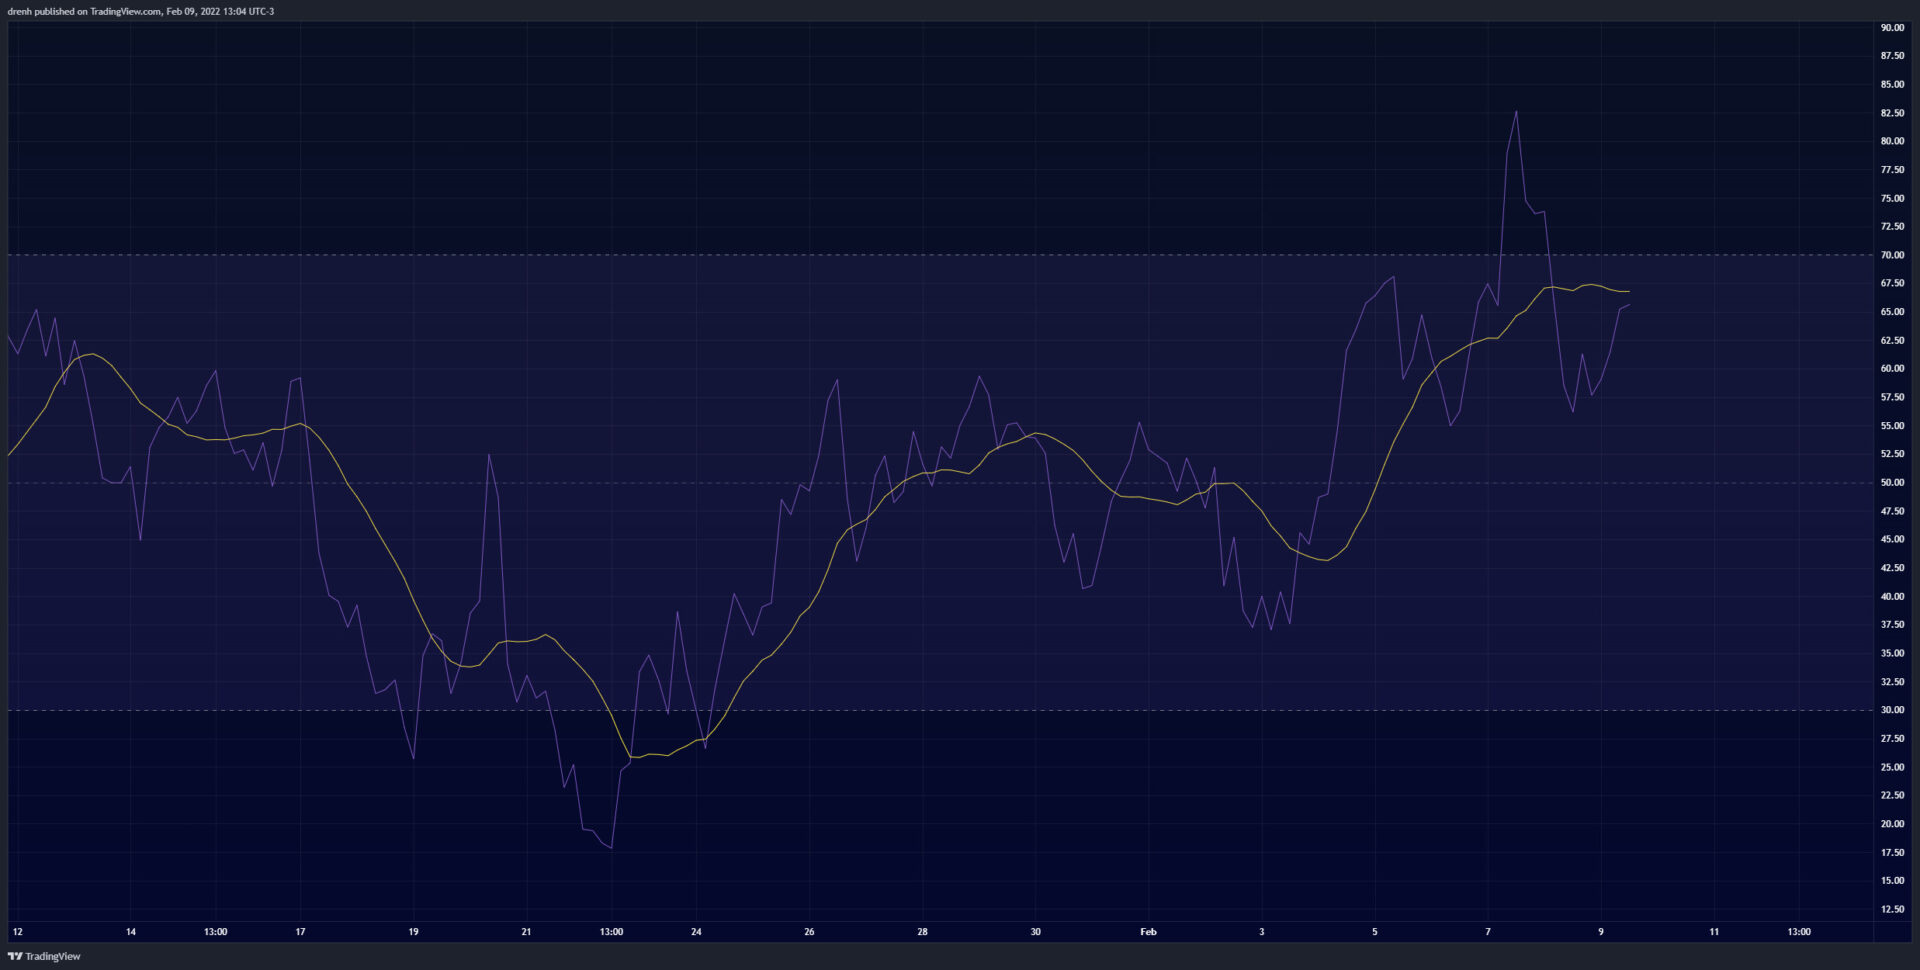
The RSI of a 4-hour chart recently hit quite above 70, indicating that MATIC became overbought. After the recent retracement, the RSI is now slightly below 70 and has little room for growth.
MACD
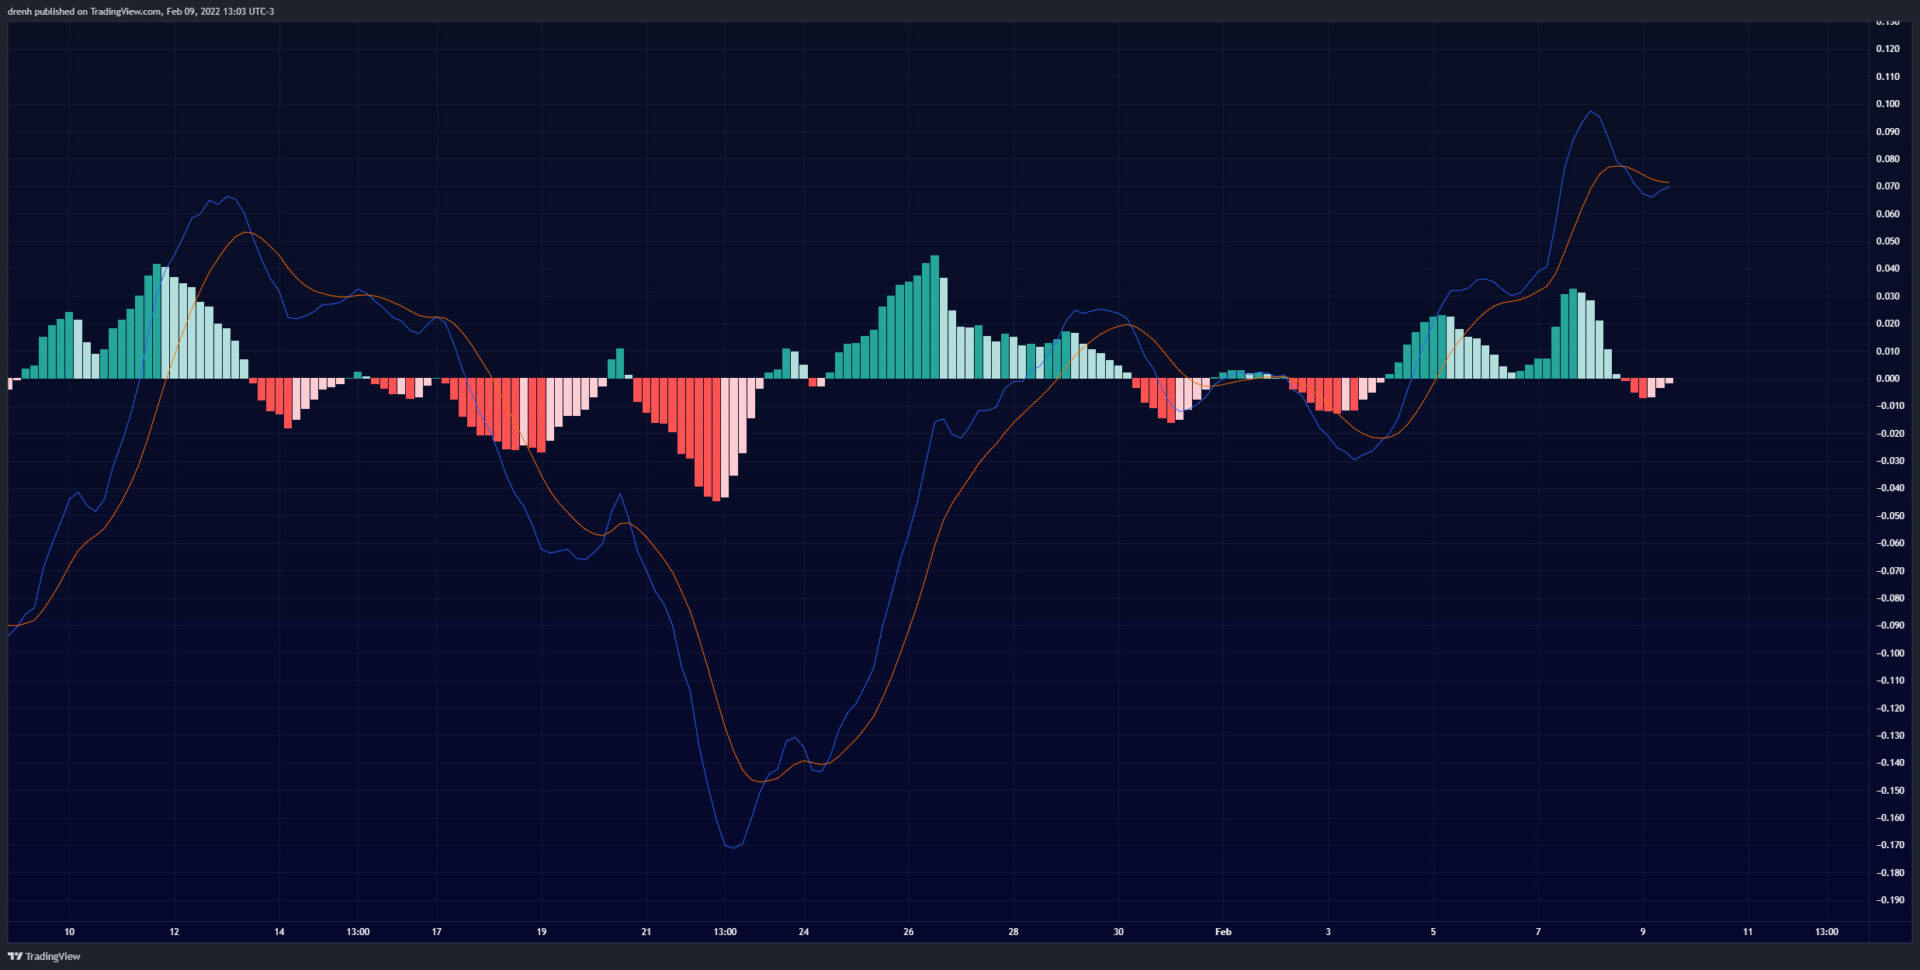
The MACD line of a 4-hour chart was slightly below the signal line and above the baseline. The lines have converged and the momentum remains bullish for MATIC in the short run.
Fibonacci
The Fibonacci retracement levels of a 4-hour chart suggest that the price of MATIC recently retraced to the 38.2% level and found support there, indicating that the price could have yet another surge upward in the coming days.
Price Prediction MATIC – February 2022
Based on this technical analysis on Polygon (MATIC), the price could keep increasing in the coming days/weeks. Since the bearish trendline is now broken, the price could continue going upward. Furthermore, indicators suggest that MATIC could soar higher in the coming days, where a price of $2.30 is attainable if it breaks resistance at $2.20. As for February, if BTC remains bullish and MATIC keeps its momentum, then we could see MATIC aim for a new all-time high in the coming weeks, other things equal.
Latest News for MATIC – Affecting Price
Projects in the Polygon network are being added every day, growing the ecosystem and making Polygon’s influence on the market even stronger. Besides new users, Polygon is also experiencing an increase in the number of developers in its ecosystem. To illustrate, 11,400+ teams of developers were recorded recently, making it a remarkable milestone for Polygon.
New milestone unlocked: #Polygon developer ecosystem on @MoralisWeb3 now has 11,400+ teams!https://t.co/6KHLhjhDif
— Polygon | $MATIC 💜 (@0xPolygon) February 4, 2022
In addition to that, Polygon is gaining more support from institutional investors every day. Just recently, Sequoia Capital invested $450 million in the latest Polygon funding round. These investments help Polygon grow, and they inevitably help in growing the price of MATIC.
🚨I’m excited to share that @sequoia has led a $450 million investment in @0xPolygon $MATIC 🚨
“Polygon has emerged as one of the clear leaders”
In addition to this raise, we’ve spent nearly $1 billion to acquire firms to broaden offerings for devs.https://t.co/X5zCBUmnkb
— Ryan Wyatt 💜🚀 (@Fwiz) February 7, 2022