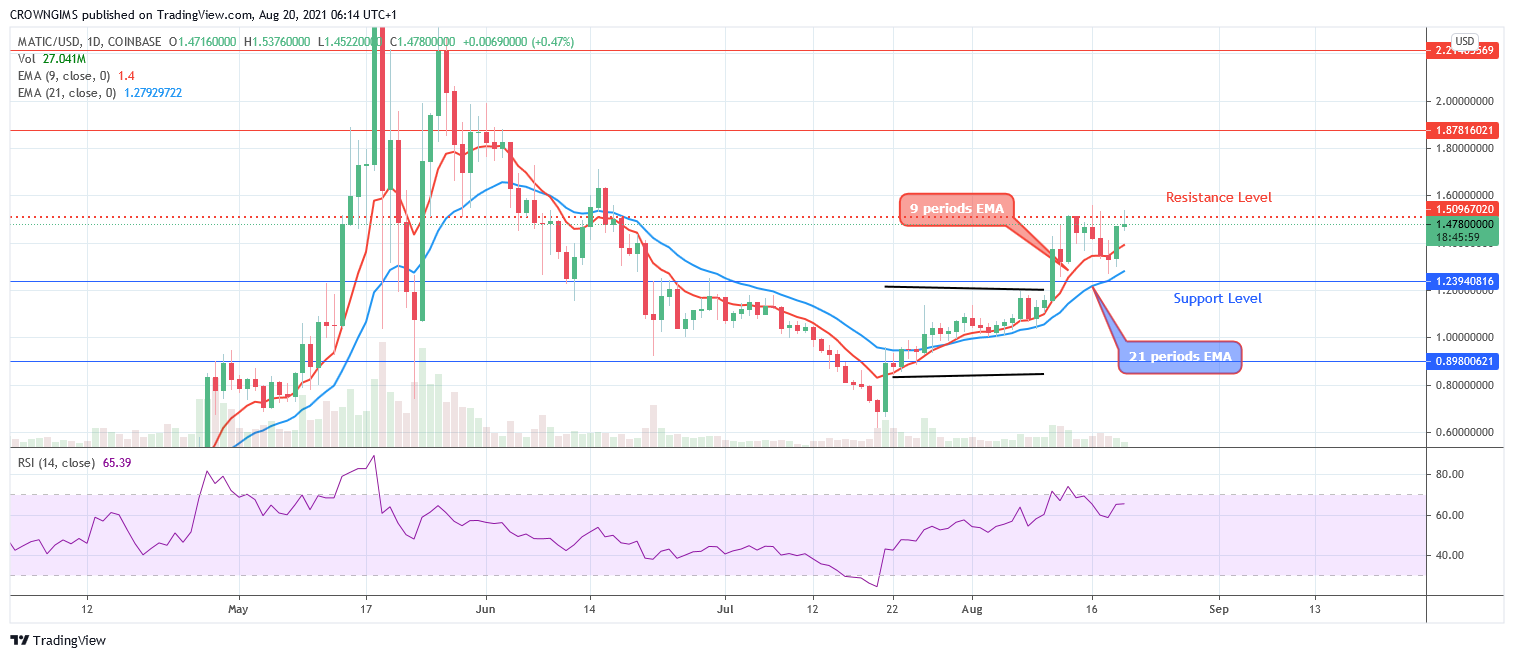
- MATIC/USD is breaking up $1.50 level
- Buyers’ pressure increases
- Bears lose momentum
The buyers may push the price above the resistance level of $1.50 which may increase to the resistance levels of $1.87 and $2.21. Inability to break up the resistance level of $1.50 may lead to price consolidation within $1.50 and $1.23, below the current price level are $0.89 and $0.21 support levels.
Polygon Key Levels:
Resistance levels: $1.50, $1.87, $2.21
Support levels: $1.23, $0.89, $0.31

MATIC/USD Long-term Trend: Bullish
MATIC/USD remains under the control of the bulls. The buyers gained more pressure after the ranging movement within the resistance level of $1.23 and support level of $0.89. The price increased and tested the resistance level of $1.50 last week, it pulled back to retest the support level of $1.23. On August 19, bulls regain strength and currently trying to break up the $1.50 resistance level.
After the price retracement to dynamic support level, Polygon continue its trading above the 9 periods EMA and 21 periods EMA. The trading above the two EMAs is an indication of bullish trend. The buyers may push the price above the resistance level of $1.50 which may increase to the resistance levels of $1.87 and $2.21. Inability to break up the resistance level of $1.50 may lead to price consolidation within $1.50 and $1.23, below the current price level are $0.89 and $0.21 support levels. The relative strength index period 14 is at 70 level pointing up to indicate buy signal.
MATIC/USD Short-term Trend: Ranging
Polygon is on the ranging movement on 4 hour chart. Since last week, polygon has been trading within the resistance level of $1.50 and support level of $1.23. Buyers have been trying to break up the resistance level of $1.50. The mentioned level has been tested three times but unable to penetrate the level. The bears’ pressure is equally weak and could not break down the support level of $1.23.
The 9-day EMA is crossing over the 21 periods EMA as an indication of bullish movement. The Polygon price is trading above the two EMAs which indicates an increase in the bulls’ momentum. The relative strength index period 14 is at 70 levels with the signal line pointing up to indicate buy signal.
Also read: Polygon (MATIC/USD) Price May Break Out at $1.23 Level
Note: Crypto-academy.org is not a financial advisor. Do your research before investing your funds in any financial asset or presented product or event. We are not responsible for your investing results