


DOT Technical Analysis – October 2021
Monthly Analysis
Over the last 30 days, DOT initially decreased by 34%. After that, the price found support at $25.5 and started increasing again. After increasing up to $33.5, then the price declined back to $26. The trend was reversed again after that and has increased by 44% in the last two weeks.
Weekly Analysis
In just the last 7 days, the price of DOT increased by around 28%. After hitting resistance at $37.4, the price has pulled back. The trend is bullish for DOT, meaning that its price could keep increasing.
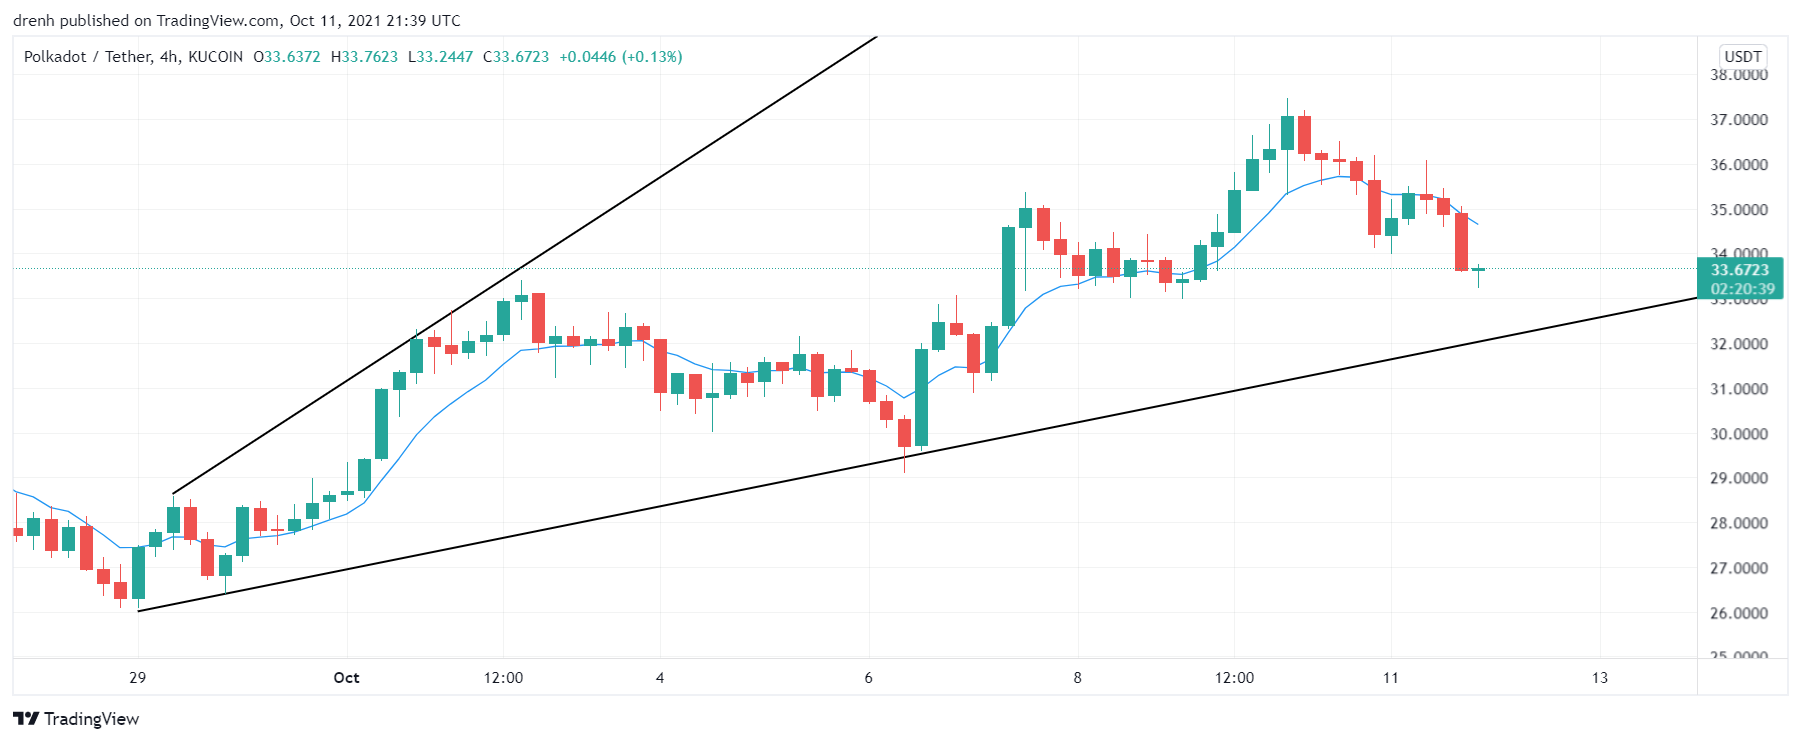

Daily Analysis
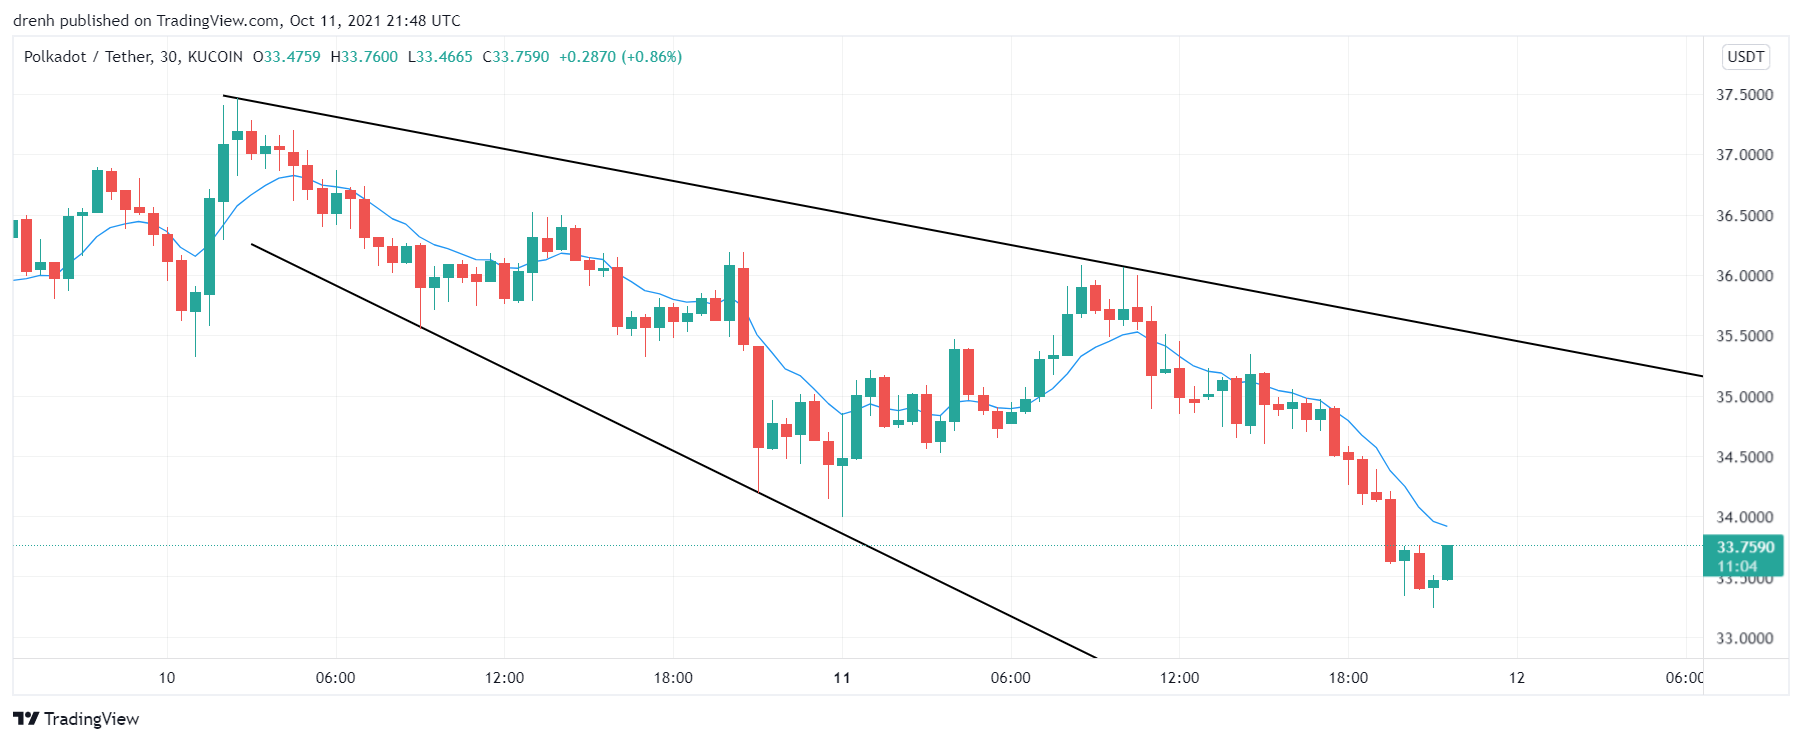
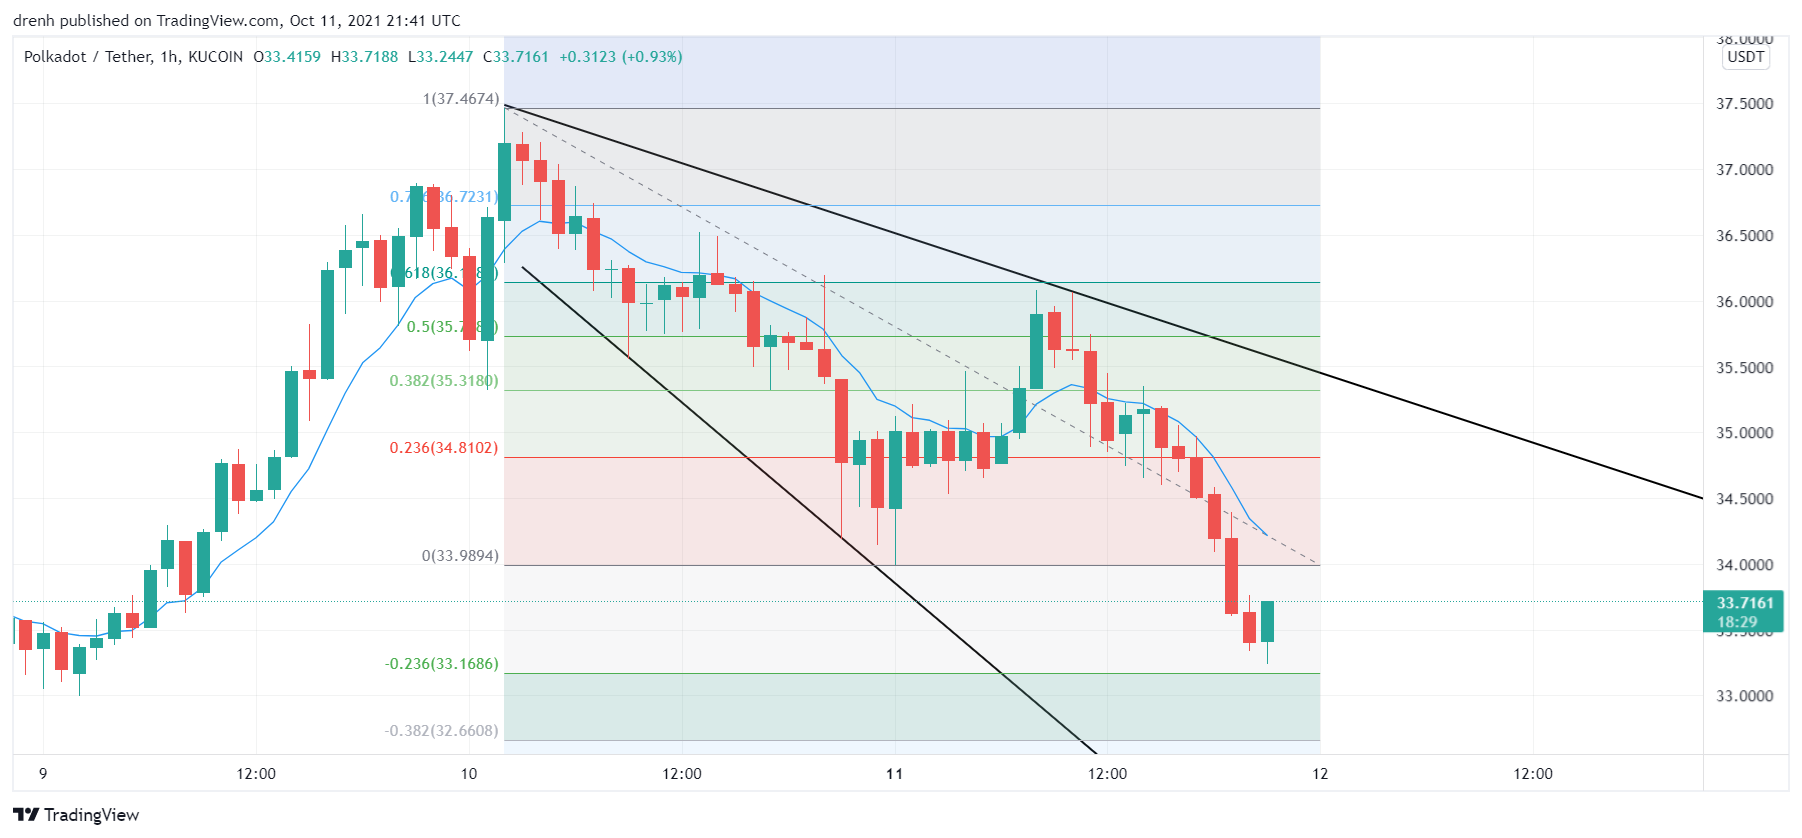
In the intraday chart, volatility levels are high for DOT. The shorter-term trend is bearish due to the recent pullback, meaning that the selling pressure is high for the coming hours.

Key Structures
Support
- $31
Resistance
- $37.5
Indicators
Moving Average
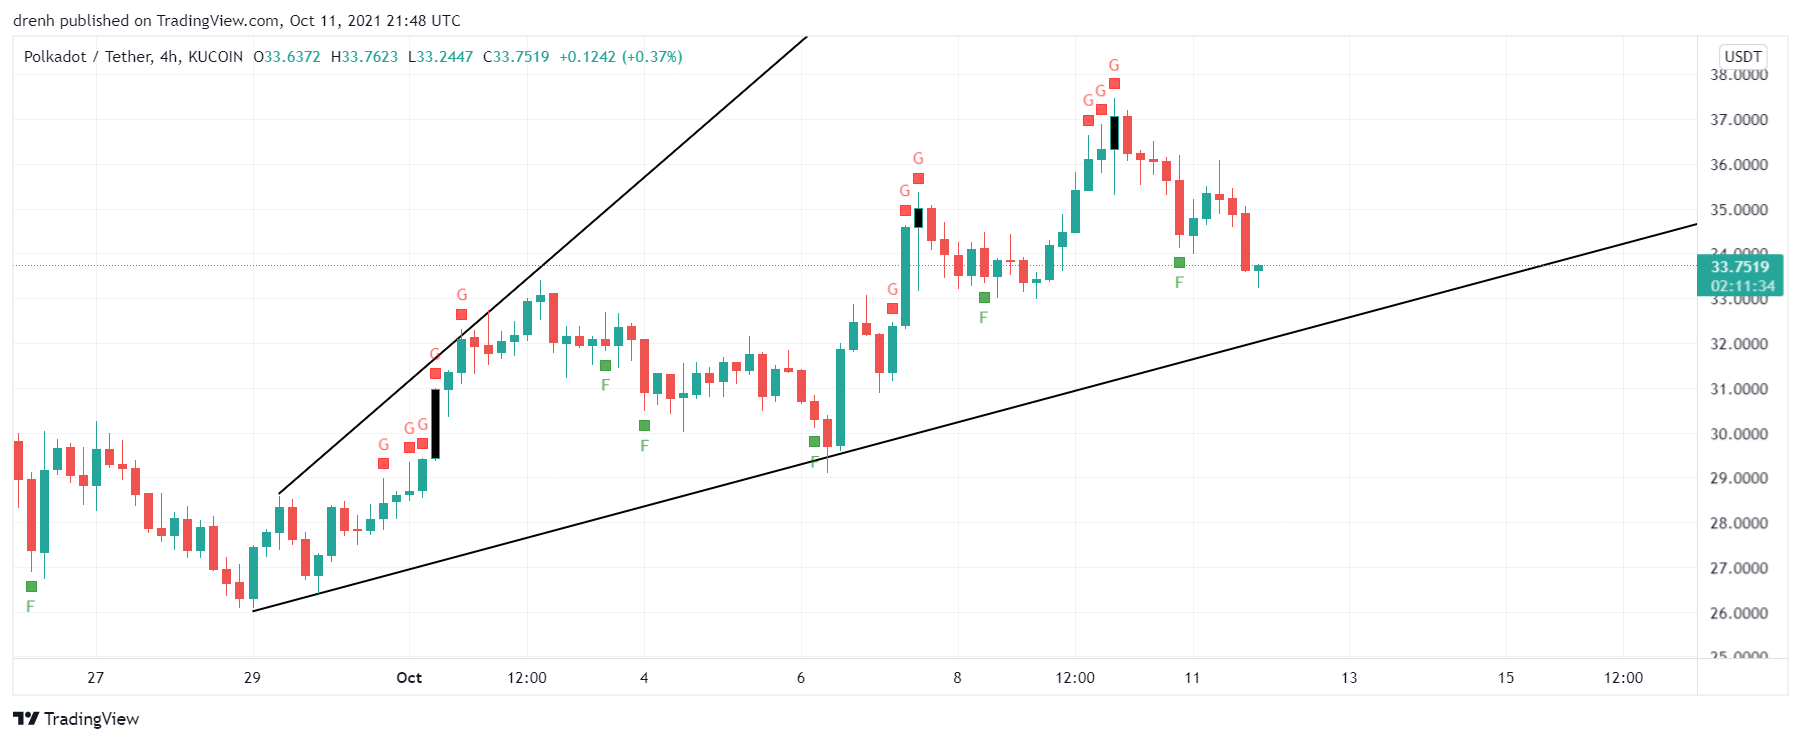
The 20-day moving average is below the price, indicating that the trend is upward and that the price can keep increasing in the coming days.
The 9-day EMA is slightly above the current price of DOT. This could indicate that the short-term trend is reversing. If the most recent candlestick closes above the EMA line, then the price could maintain its bullish nature in the short run.
Relative Strength Index
The RSI of a daily chart has slightly declined recently due to the latest pullback. However, the RSI is close to 50, meaning that the price of DOT has room to go both ways, upwards or downwards. In a 4-hour chart, the RSI is approaching the oversold region, meaning that the current momentum is bearish and that the price could keep decreasing.
MACD
In a daily chart, the MACD line is above the signal line and above the baseline, indicating that the momentum is bullish for DOT. Nonetheless, the lines are converging. In a 4-hour chart, the MACD line is quite below the signal line and has now moved below the baseline, indicating that the shorter-term momentum is bearish for Polkadot.
Fear & Greed
The fear and greed indicator suggests that the current emotion of DOT traders is fear, meaning that the price is bearish in a 4-hour chart.
Fibonacci
The Fibonacci retracement levels were respected numerous times in the recent price movement. First, the price retraced to the 61.8% level and then went for the 23.6% extension level.
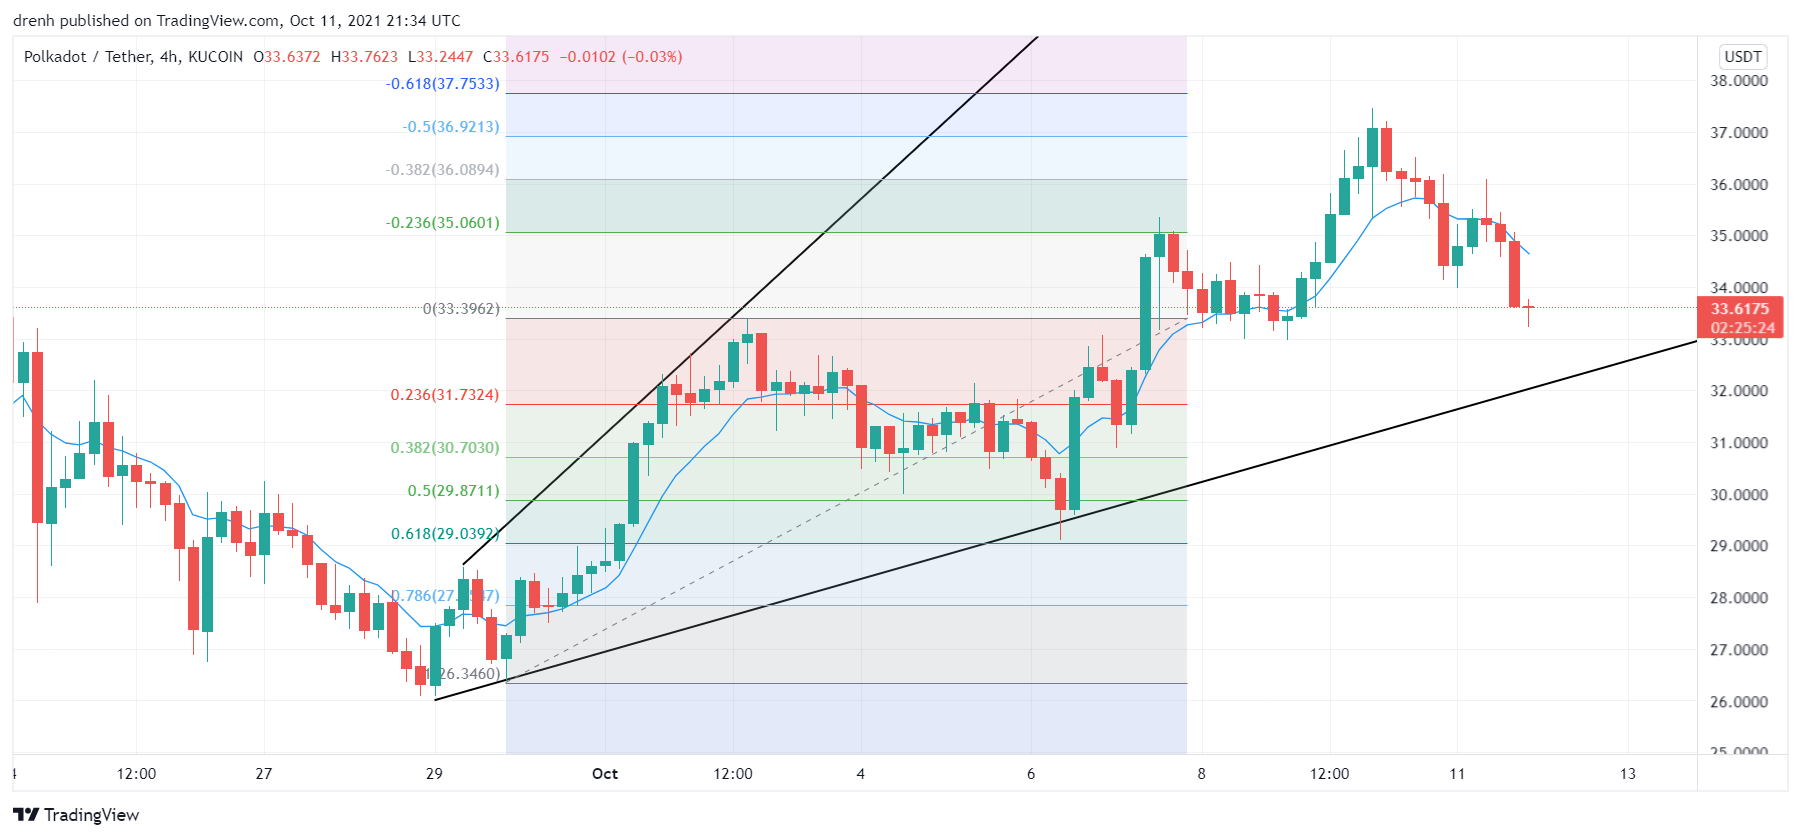

After that, the price had another increase and retraced to the 38.2% level, where then it aimed for the 23.6% extension level once again.
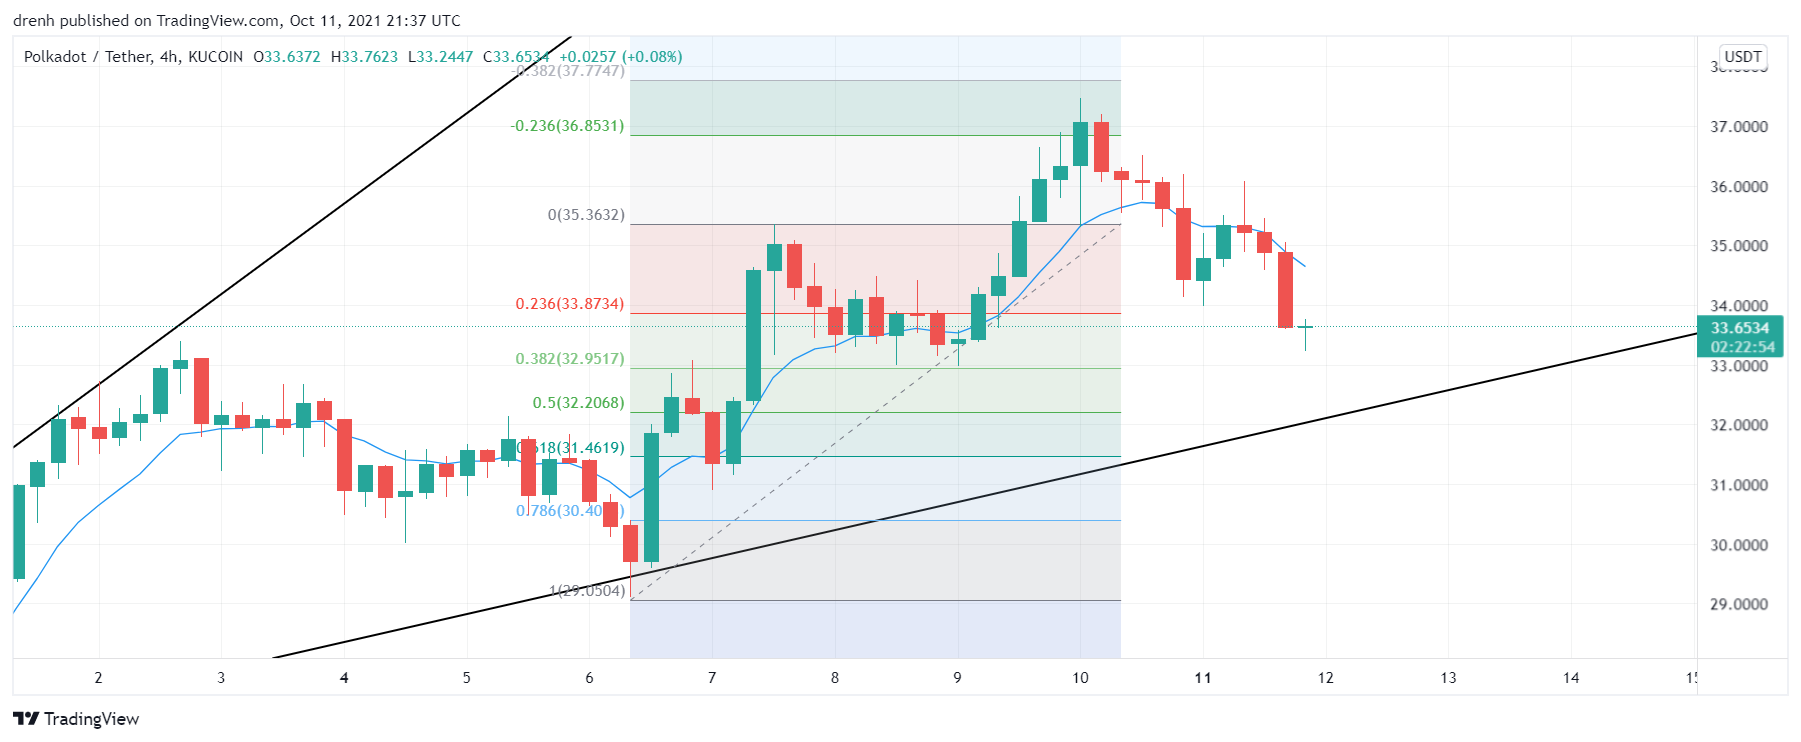
In the recent pullback, Fibonacci was respected once again, where the price retraced to the 61.8% level in the downward trend, and then it went for the 23.6% level. This could indicate that DOT might keep retracing to one of the levels if it has other price breakouts.

Price Prediction DOT – October 2021
Based on this technical analysis, DOT is still bullish in the longer term, but it is bearish in the intraday chart. If DOT finds support at the projected structures, then we could see DOT increase in the coming days. If BTC maintains its bullish nature, then the price of DOT could aim to break its all-time high soon. If that occurs, then a price of $100 is also possible in the coming weeks, other things equal.
Latest News for DOT – Affecting Price
Polkadot has announced that it may soon launch parachains in its network. When that happens, experts are predicting that the price of DOT could soar upwards. This could be another indicator that DOT could aim for $100 in the coming weeks.
Also read: Polkadot Price Prediction 2021 and Beyond – Is DOT a Good Investment?