


DOT Technical Analysis – November 2021
Monthly Analysis
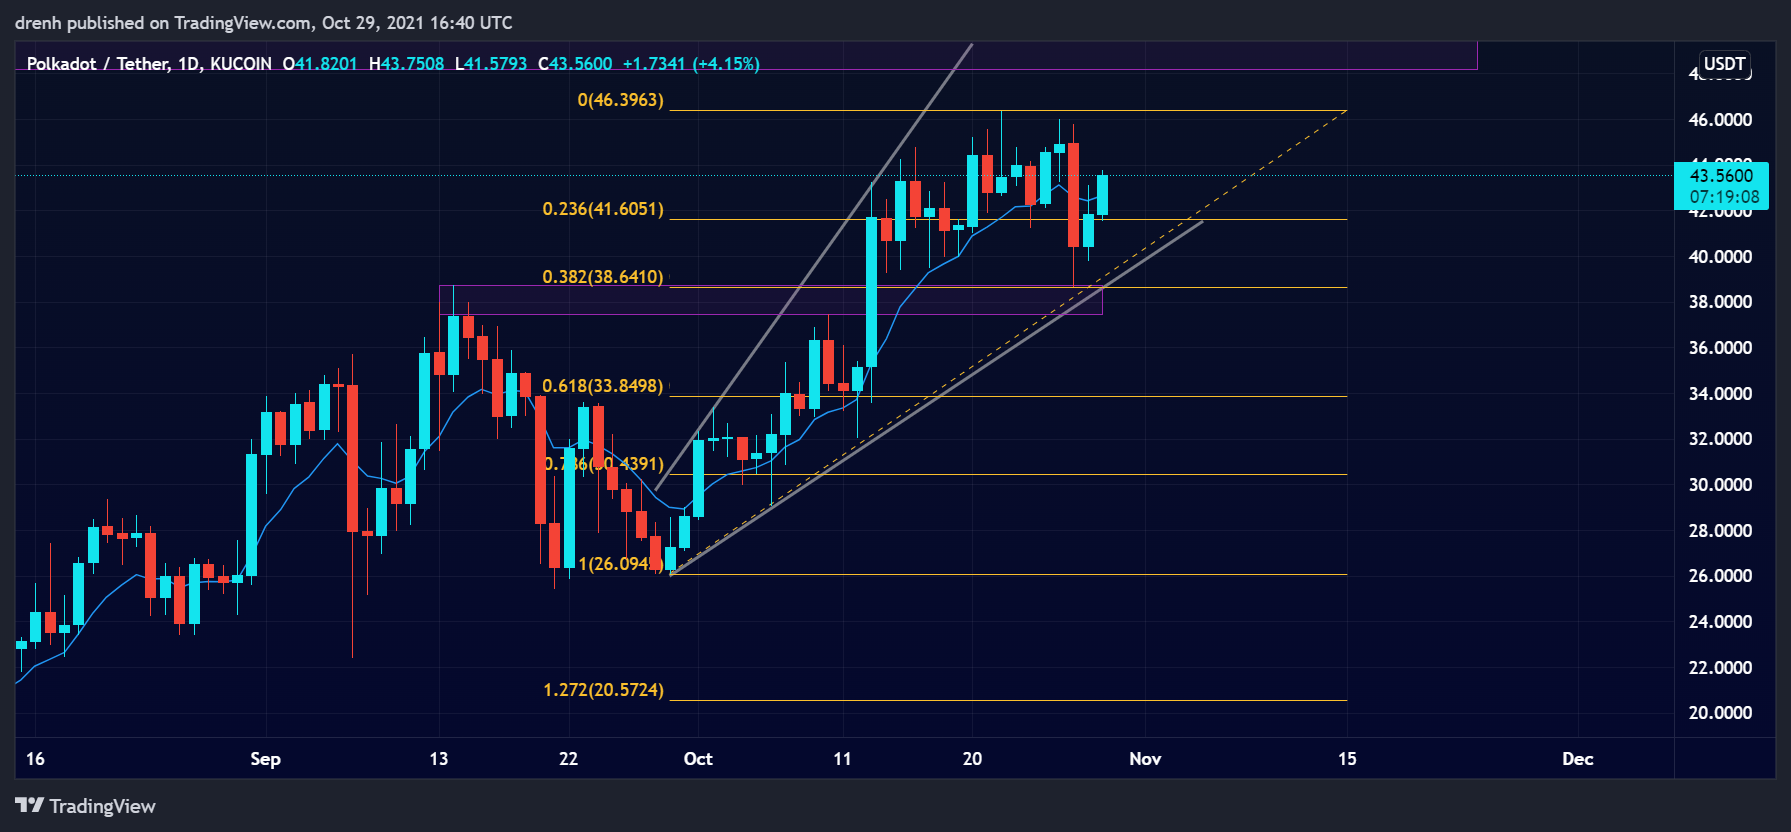
Over the last 30 days, the price of DOT has increased by around 77%. It has failed to reach a new all-time high after being stopped at $46.3. Nonetheless, the trend is upward, and the price could keep increasing in the coming weeks as well.


Weekly Analysis
In the last 7 days, the price of DOT has been retracing. It has dropped by around 16%, but the buying pressure prevented the trend from reversing. Because of this, the price of DOT has started increasing again.
Daily Analysis
In the intraday chart, DOT had a bullish breakout of around 5%, but it then started declining. Therefore, traders were slightly bearish in the intraday chart, but DOT could still increase if it finds support at $41.5 in the coming hours.
Key Structures
Support
- $39.80
Resistance
- $46
Indicators
Moving Average
The 20-day moving average is slightly below the price, indicating that the trend of DOT is still upward and that the price can keep increasing in the coming days.
The 9-day EMA has climbed above the price and is currently acting as resistance. If the daily candlestick closes above this EMA line, then we could see the price of DOT keep increasing.
Relative Strength Index
The RSI of a 1-day chart has been fairly average, but it has shown signs of an increase in the last few hours, meaning that buyers are slowly taking over for Polkadot.
MACD
The MACD line has now moved below the signal line and is heading below the baseline, meaning that the momentum could now be bearish and that the price of DOT could decrease in the coming days.
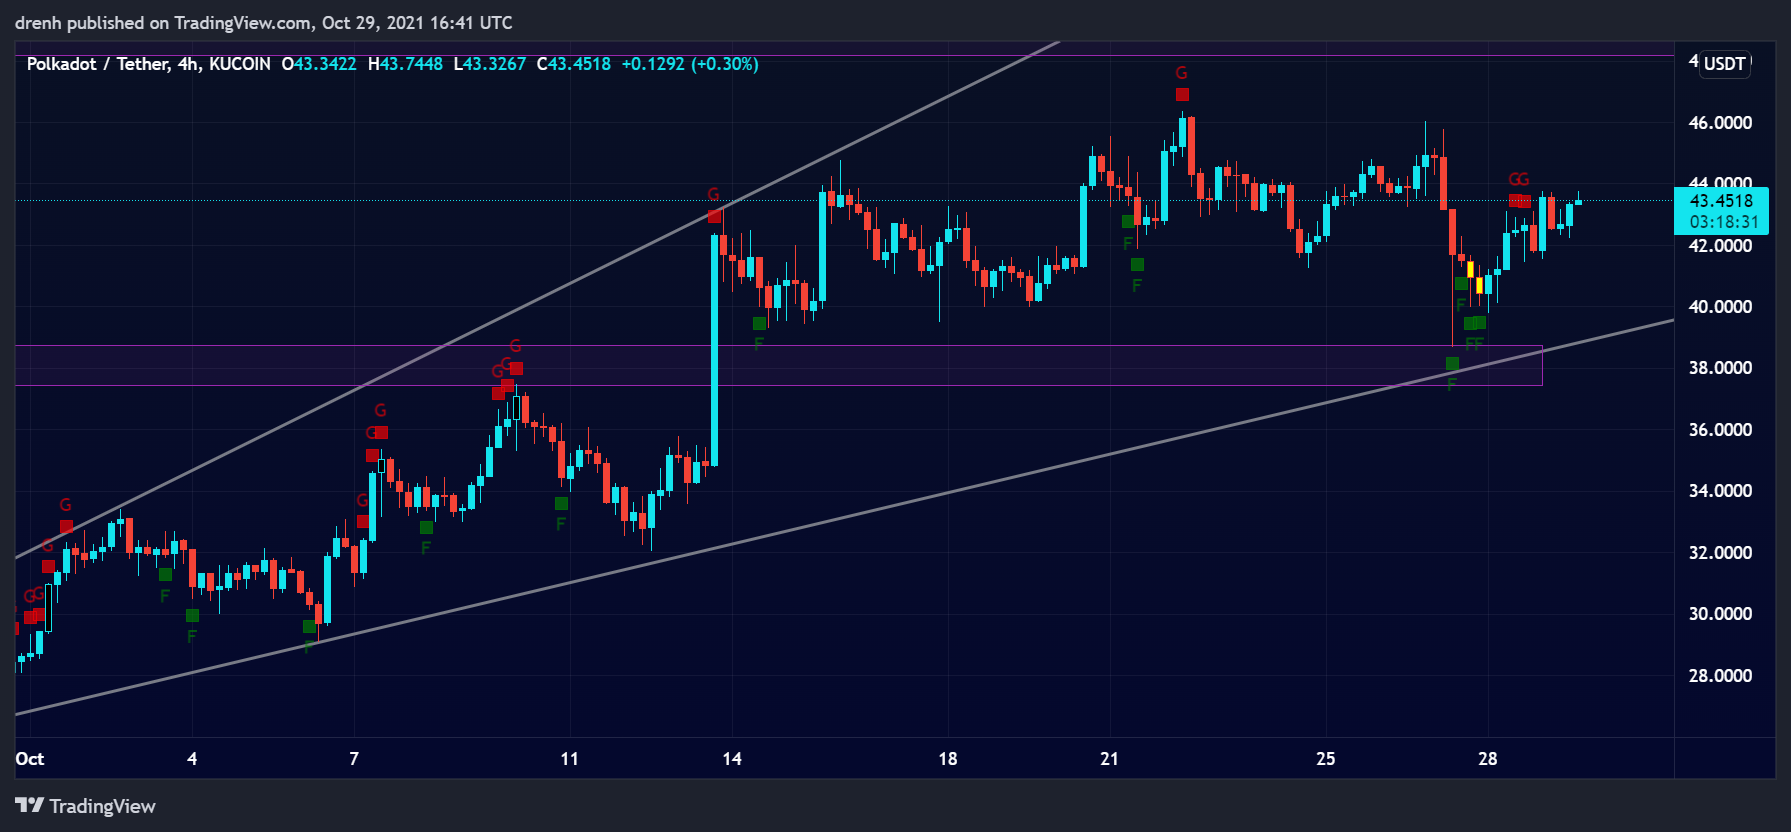
Fear & Greed
The fear and greed indicator of a 4-hour chart suggests that the current emotion of DOT traders is greed due to the recent upward movement in the price.

Fibonacci
The Fibonacci retracement levels of a 1-day chart suggest that DOT has recently retraced and found support at the 38.2% level, meaning that the price could move even higher in the coming days.
Price Prediction DOT – November 2021
Based on this technical analysis on Polkadot (DOT), we could see its price reach a new all-time high in the coming days as the price has retraced to a Fibonacci level and could go to at least $54 very soon. After that, there is no telling on how far can DOT go because it enters an undiscovered price region. Nonetheless, if BTC keeps its pace and DOT follows the same pattern, we could see the latter go close to $100 in this bull cycle.
Latest News for DOT – Affecting Price
Recently, Gavin Wood, the founder of Polkadot, has announced that a development fund worth $777 million will be introduced before the Polkadot parachains are live. This can have a positive effect on the price of DOT in the coming week, with the parachains looking to revolutionize Polkadot.
Also read: Polkadot Price Prediction 2021 and Beyond – Is DOT a Good Investment?