


DOT Technical Analysis – May 2022
The first quarter of 2022 was generally bearish for the price of Polkadot (DOT). Nonetheless, DOT managed to have a correction in the following weeks, after finding initial support at $14. While the price managed to go as high as $23.7 at the beginning of April, hinting at a possible reversal, DOT started to decline.
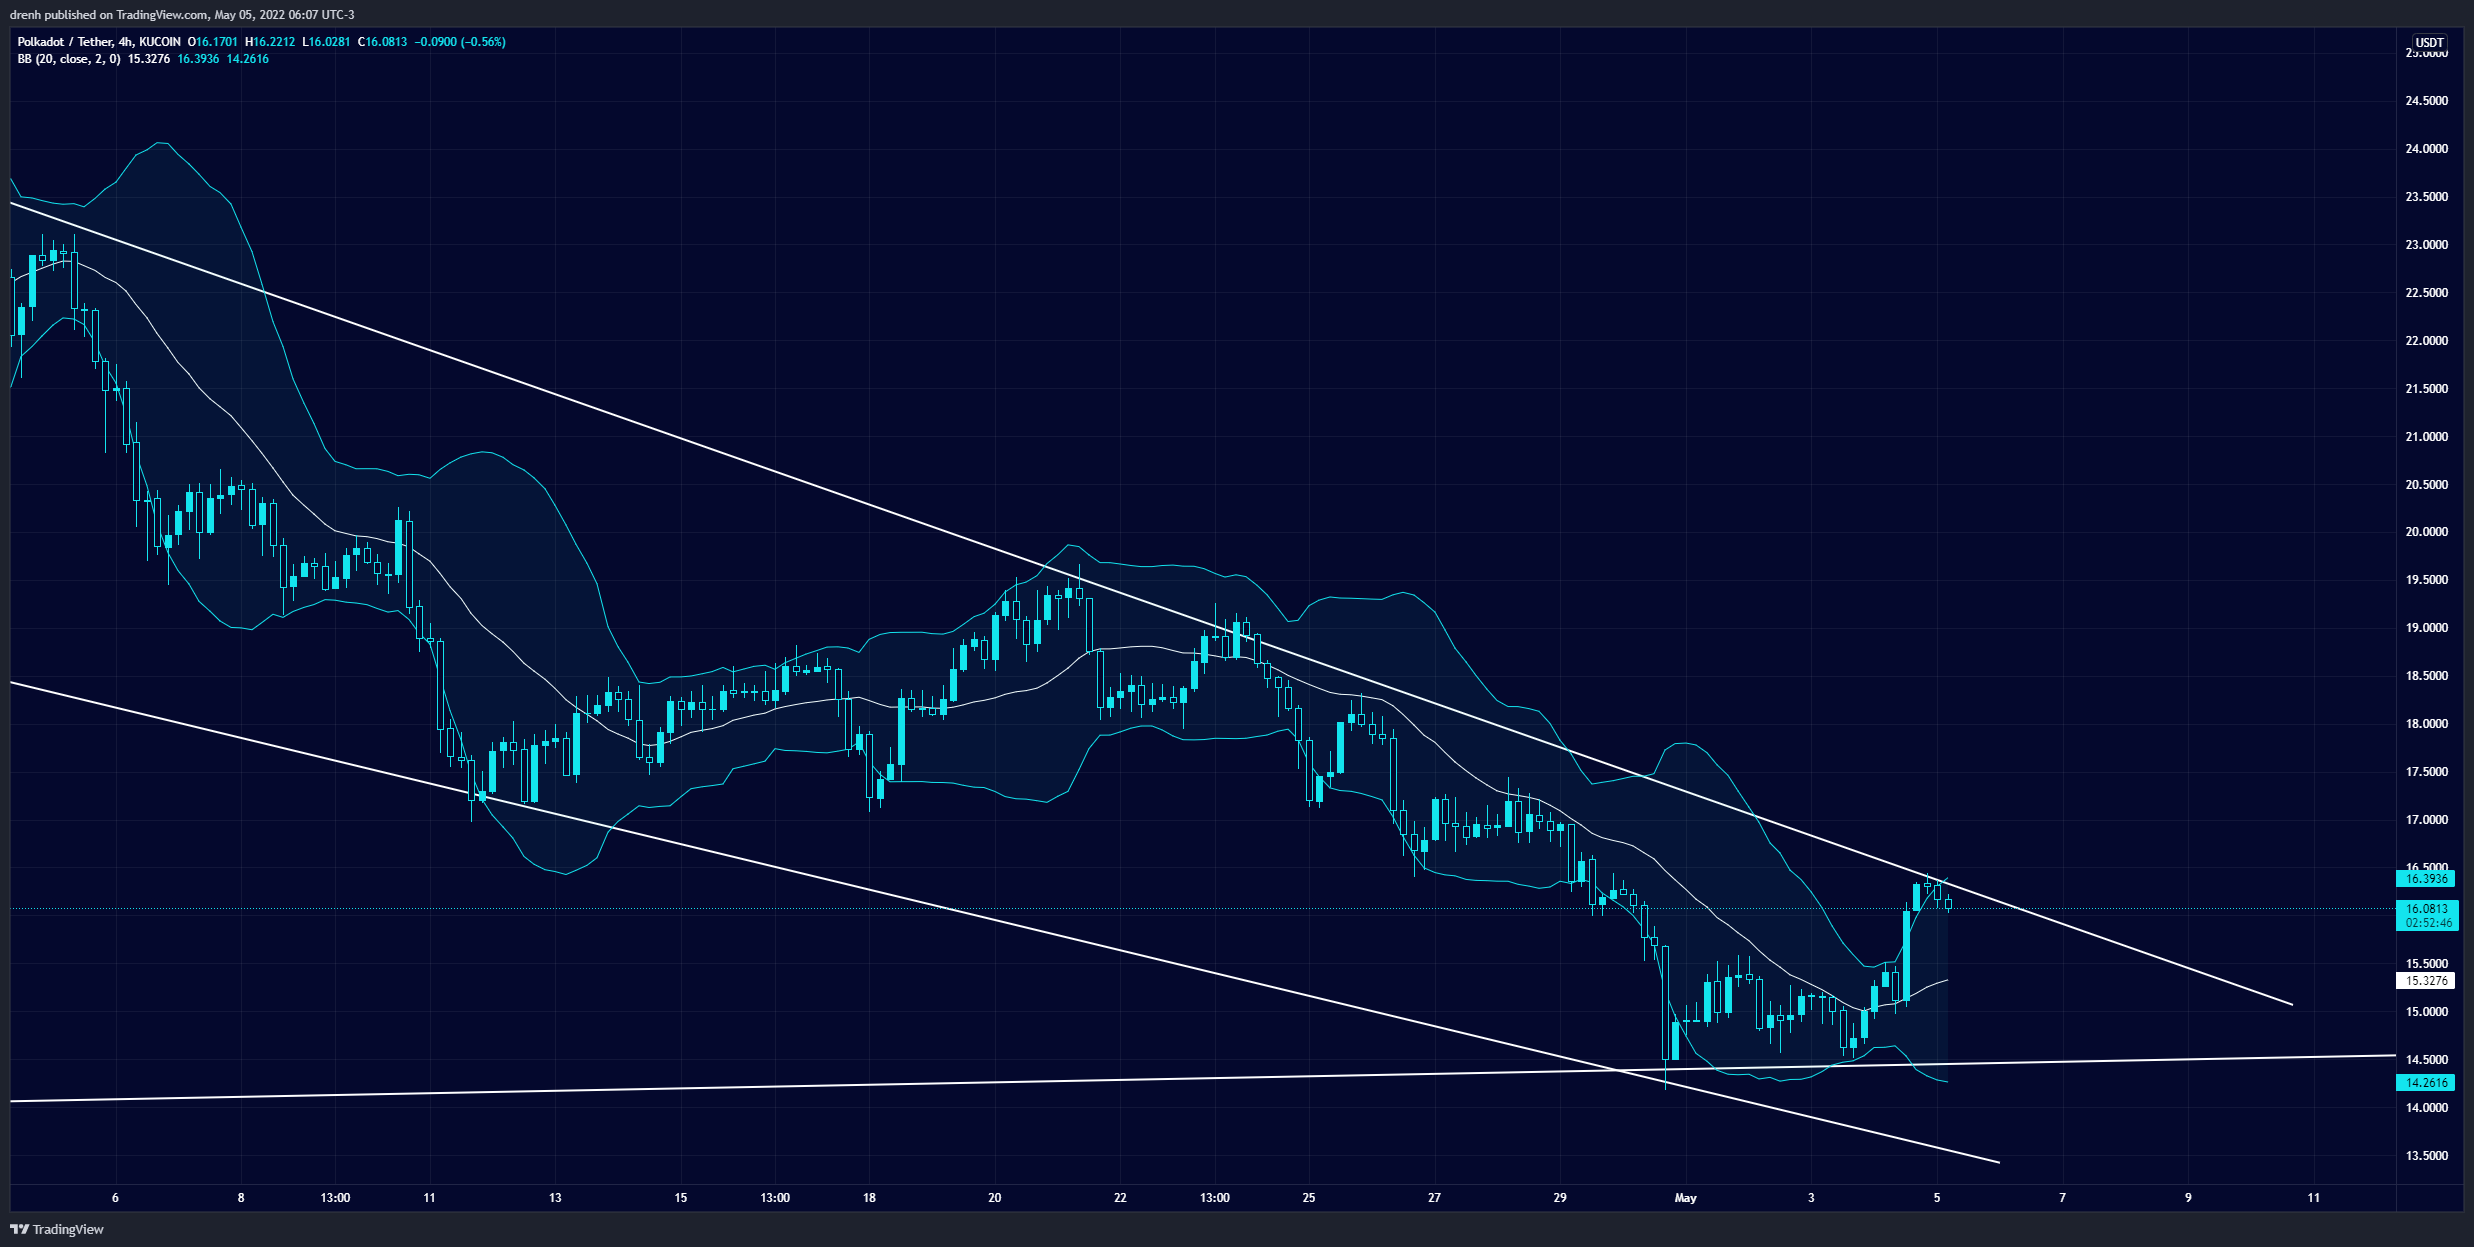
DOT declined by around 30% in the first couple of weeks of April, finding support at $17. Then, the price rebounded but faced resistance at $19.60. After that, the price continued to decline. It hit as low as $14.4 recently, where it found support on two occasions. This strong support could prove to be a good reversal zone for DOT.
Recently, DOT had another surge in the price, where it is currently trading at around $16. Due to strong resistance at $16.5, the price of DOT was unable to break the upper trendline structure.
The fear and greed index shows dominant signs of fear, but that slightly diminished due to the recent correction. The Bollinger bands show higher signs of volatility as the bands widen. With the price edging close to the upper band, the price of DOT could keep retracing in the shorter run. The longer-term trend suggests that the price could find support at $14.4.

Key Structures
Support
- $14.4
Resistance
- $16.5
Indicators
Moving Average
Due to the recent correction, both the 20-MA and the 50-MA are currently below the price of DOT, meaning that the trend could now be bullish for the coming days/weeks.
The 9-EMA is also below the current price of DOT, meaning that the price could be bullish in the shorter run as well.
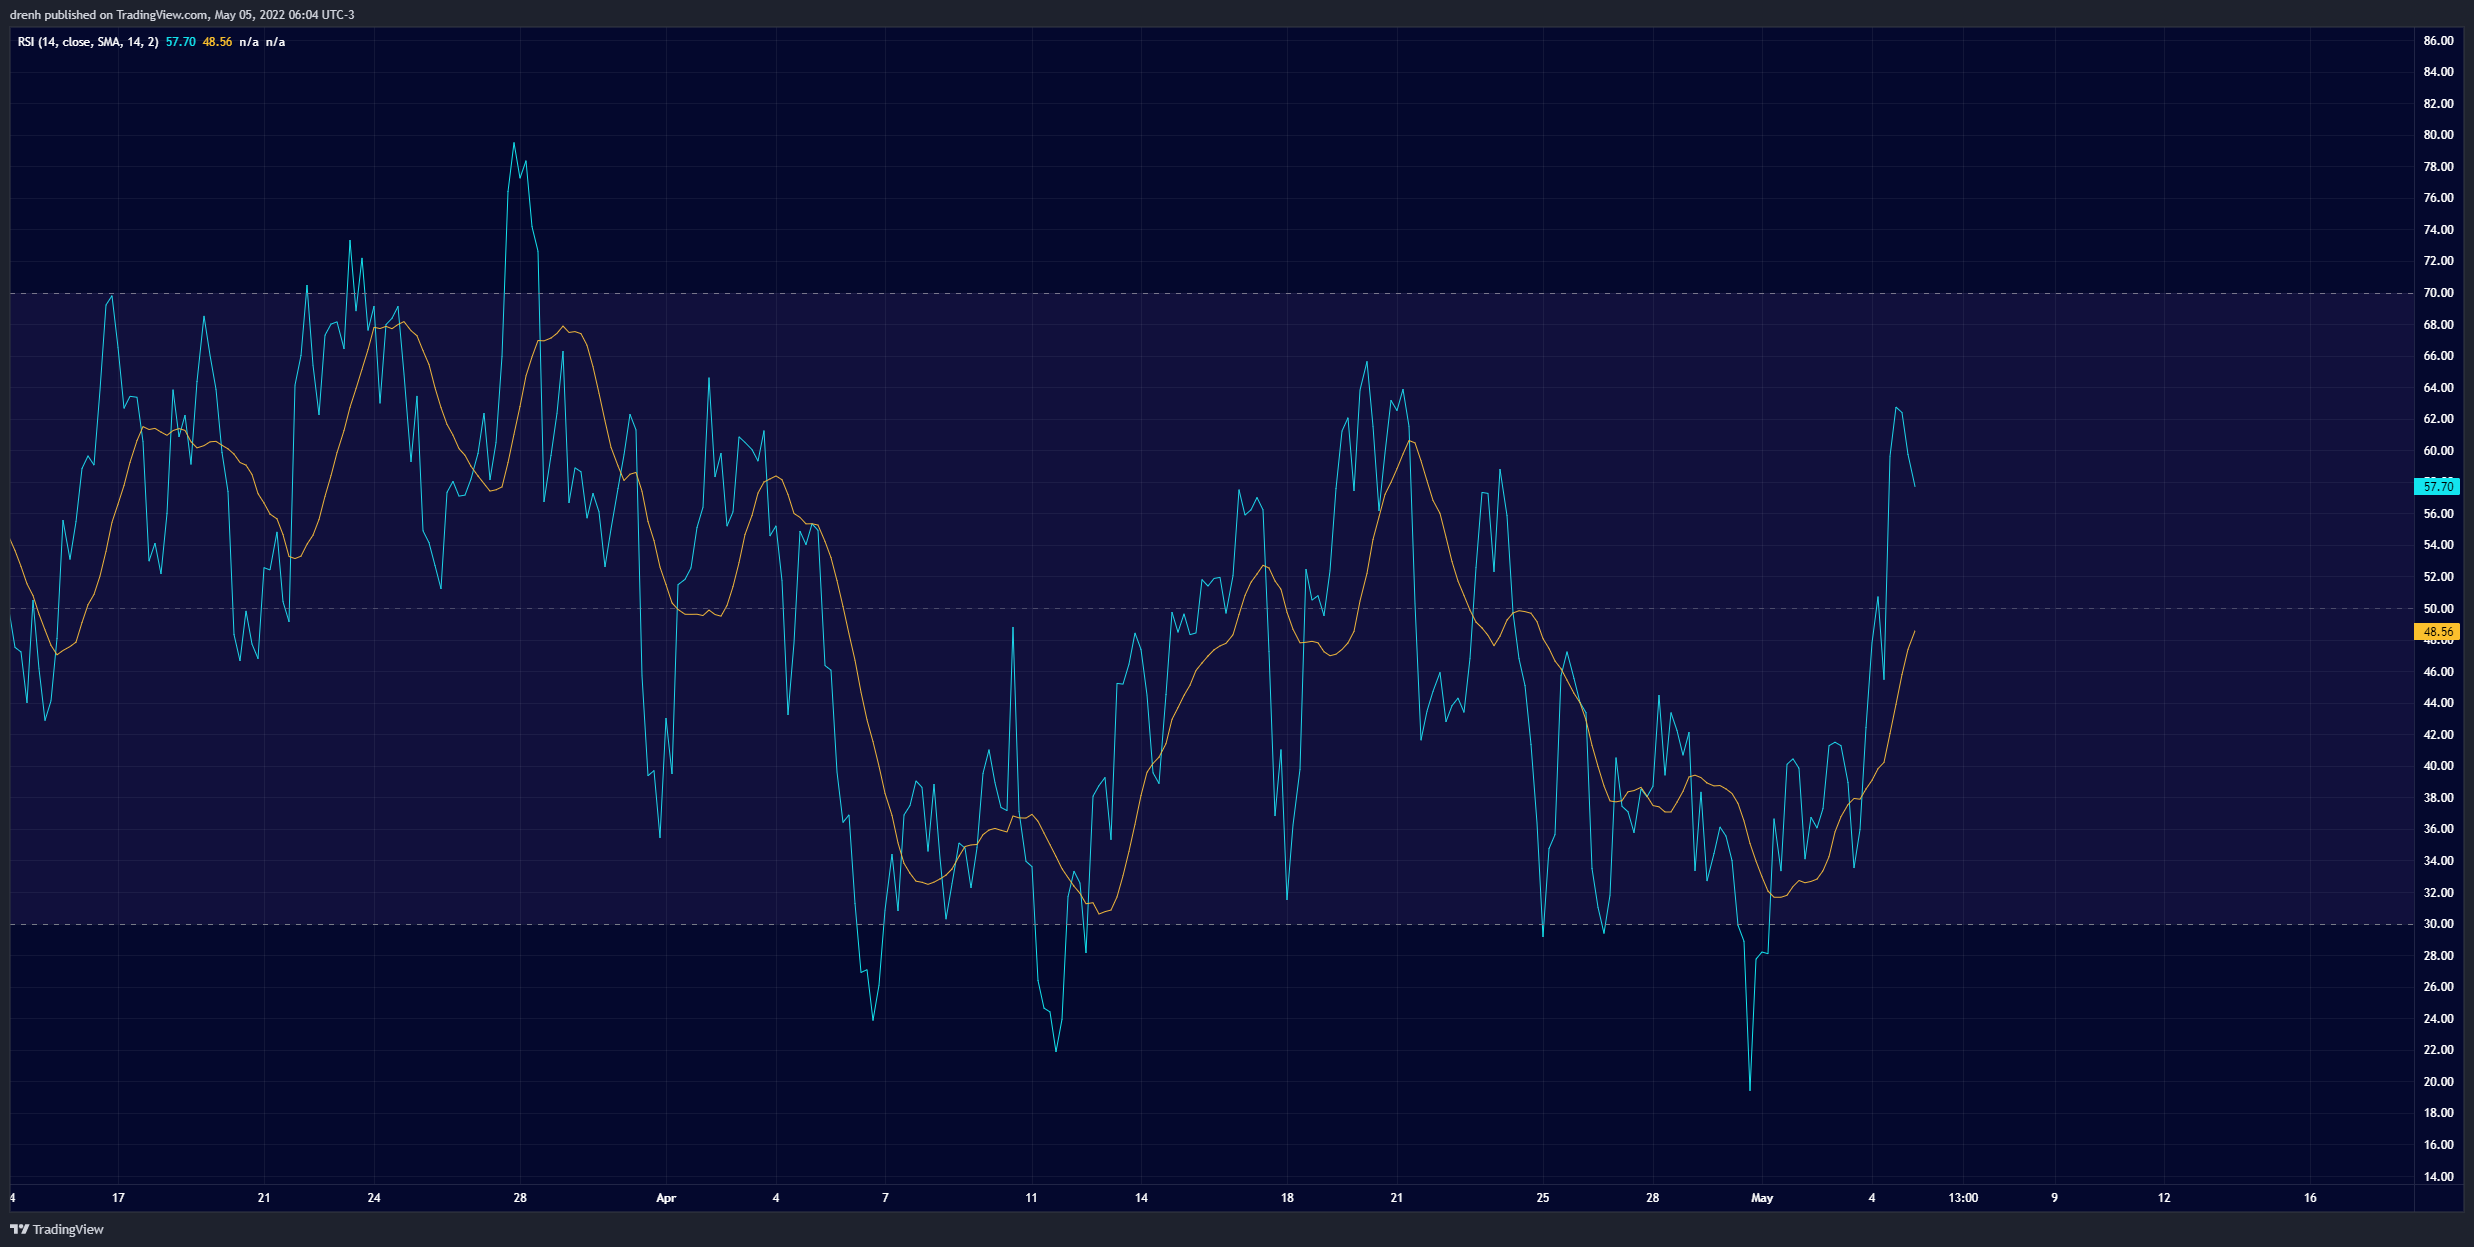
Relative Strength Index
The RSI of a 4-hour chart recently hit below 30, where DOT became oversold. Since the price recovered, it is now above the equilibrium, meaning that the buying pressure has increased. Since it is yet to approach 70, DOT has still room for more growth in the short run.
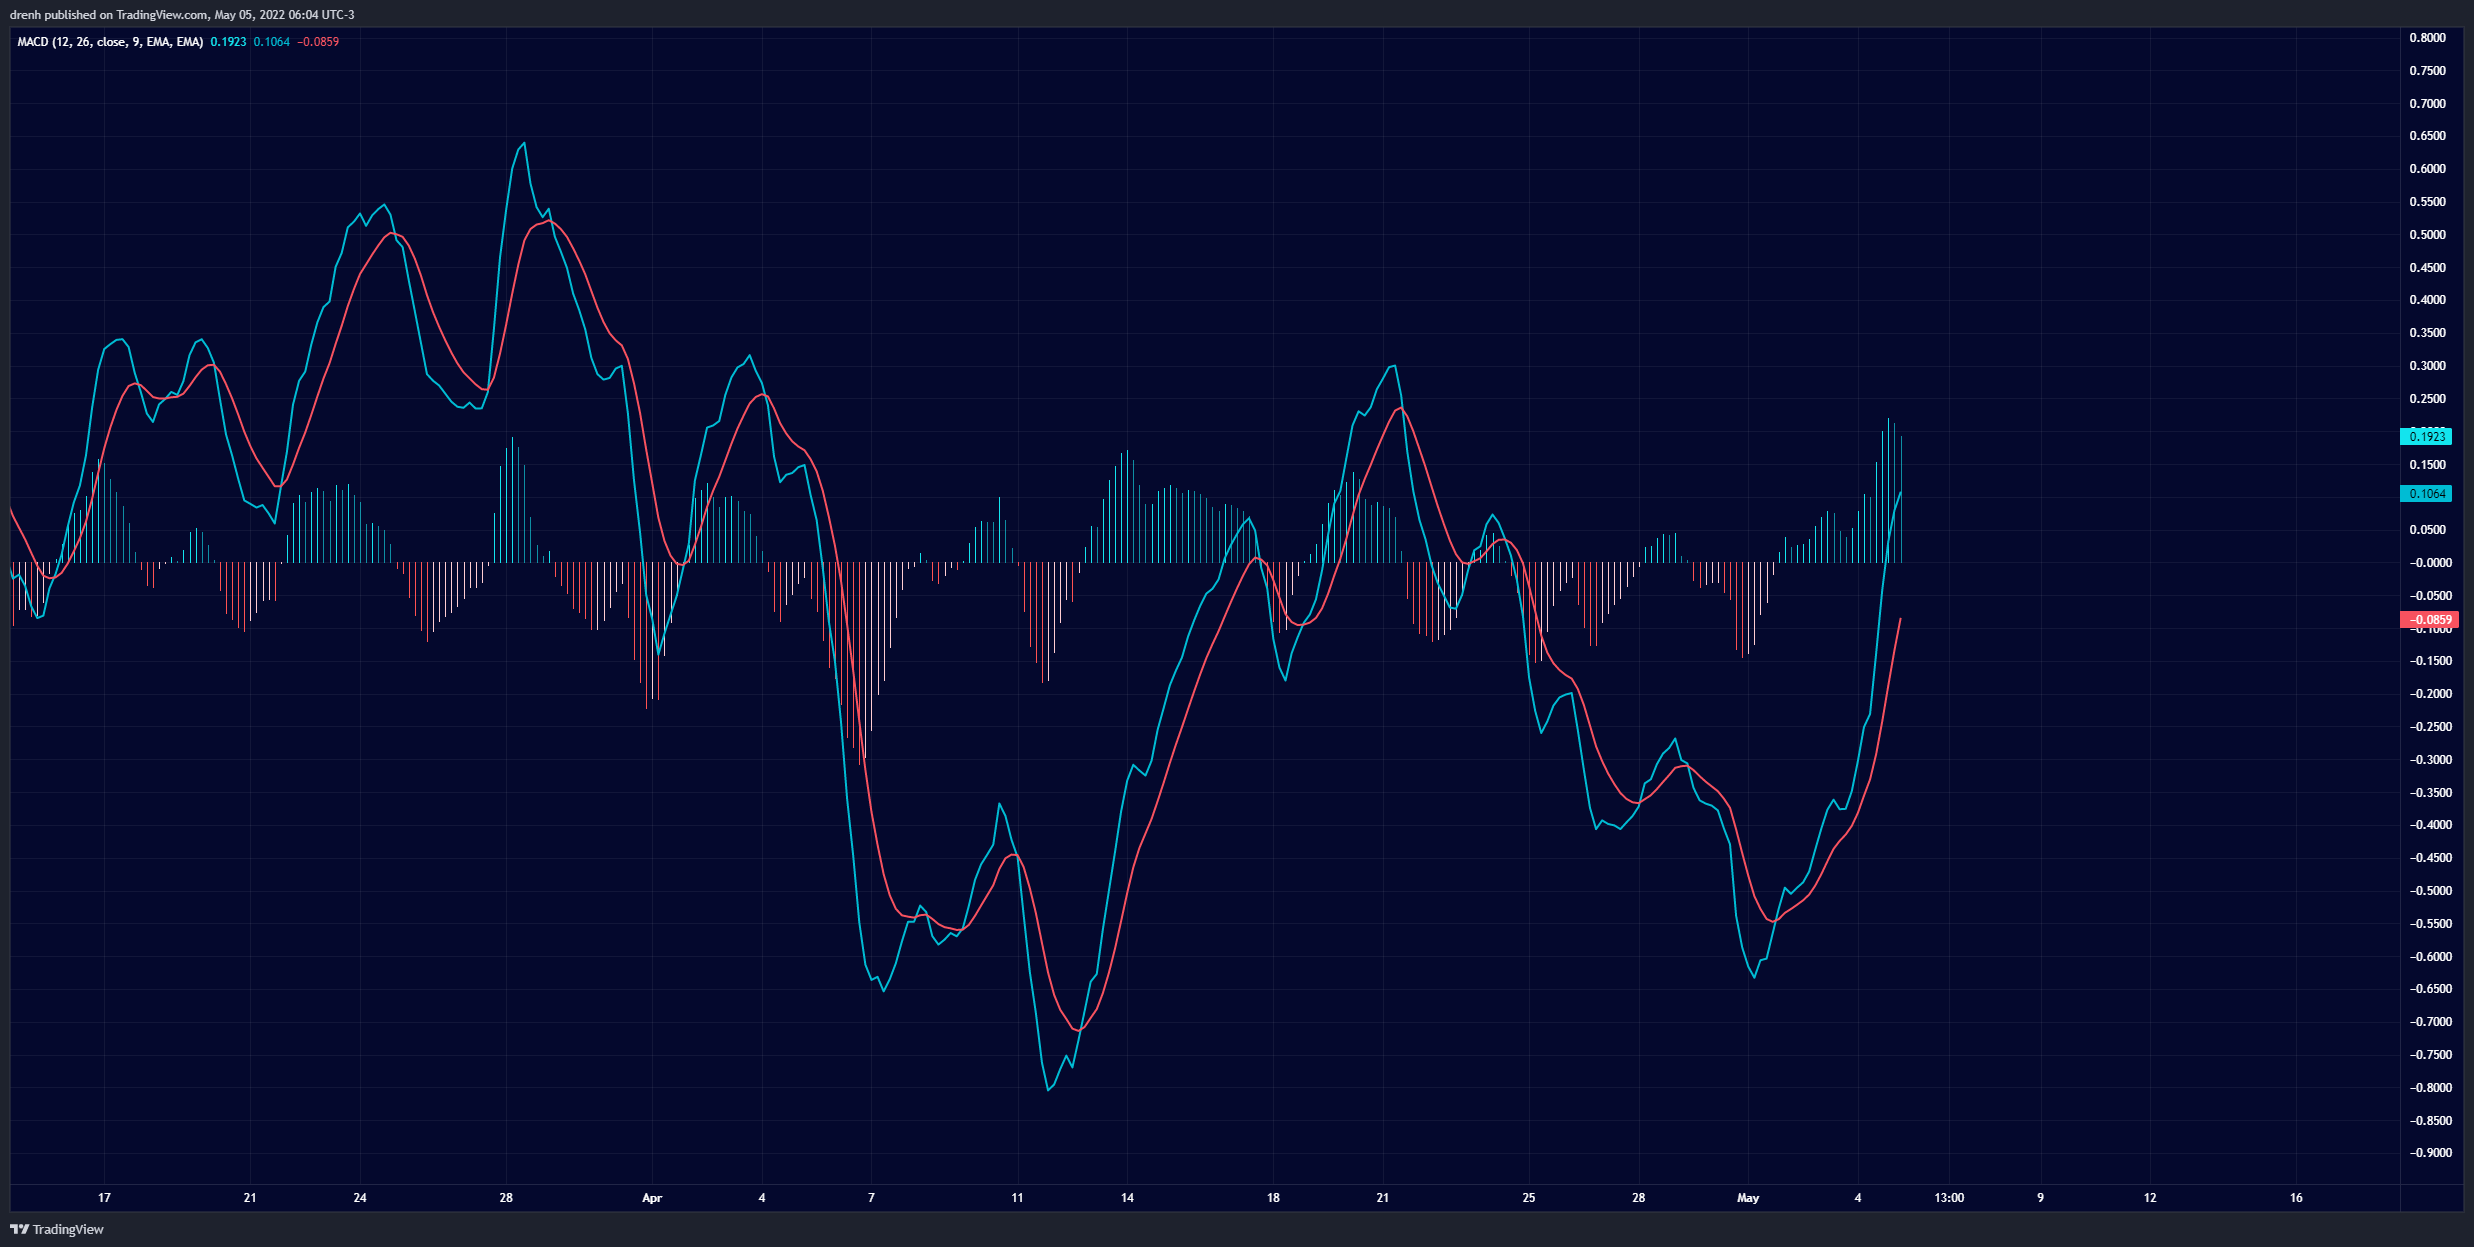
MACD
The MACD line of a 4-hour chart is currently above the signal line and now above the baseline. This suggests that the momentum is now bullish in the 4-hour chart, meaning that DOT may keep increasing. We could see the lines converge, however.
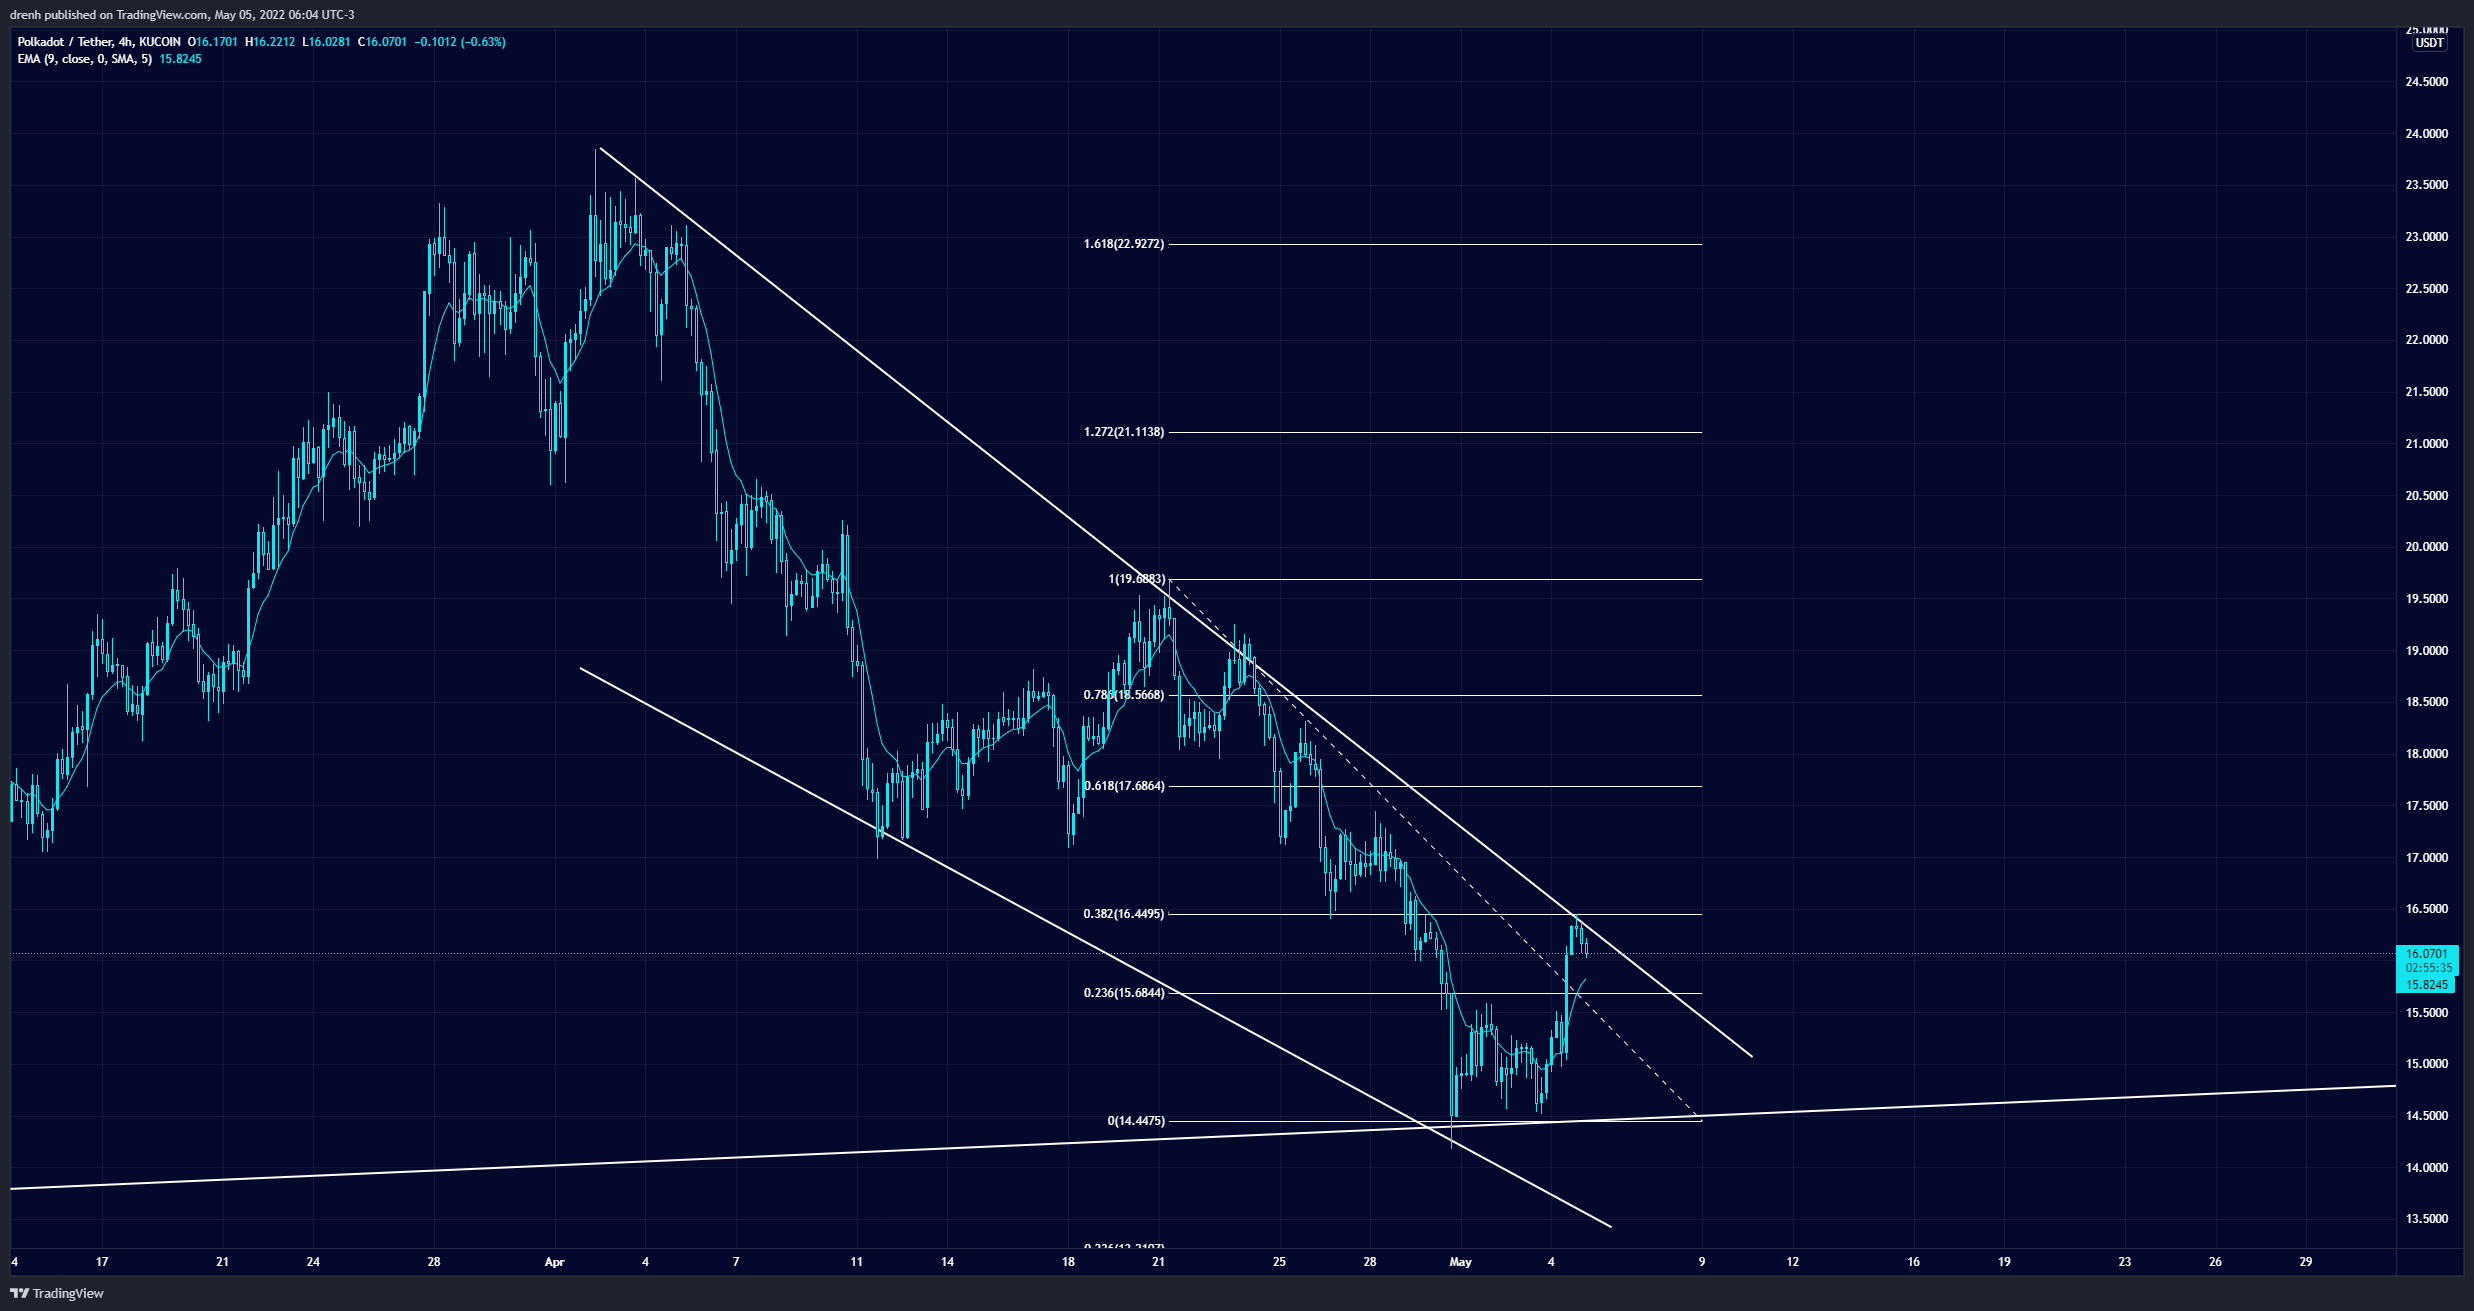
Fibonacci
The Fibonacci retracement levels of a 4-hour chart show that DOT hit resistance at the 38.2% level, meaning that the price could keep declining in the short run, other things equal.

Price Prediction DOT – May 2022
Based on this technical analysis of Polkadot (DOT), the price of DOT may keep declining in the short run. However, if DOT finds support at our projected structure in the 4-hour chart and forms a double bottom pattern, then we could see DOT have another go upward. If resistance at $16.5 is broken, we may eventually see the price of Polkadot (DOT) reverse the trend in the 4-hour chart and aim for $25 in the coming weeks of May, other things equal. Of course, depending on the price movement of BTC, DOT could move both ways. If BTC keeps its bullish nature, then there’s no reason to believe that DOT cannot aim further high in the coming weeks.
Latest News for DOT – Affecting Price
Despite what technical indicators suggest, the price of DOT is likely to be influenced by fundamental factors. For instance, through the use of XCM format, parachain communication is now available in Polkadot. This makes the DOT ecosystem more cross-chain interoperable and highly boosts the communication stream between Polkadot parachains.
Polkadot’s parachain-to-parachain communication is now enabled with XCM. Polkadot’s vision of cross-chain interoperability starts here.
To learn more tune into the community call next week: https://t.co/MKDB8AO5x2
To open an HRMP channel: https://t.co/42B1sVvuoA pic.twitter.com/xr2mDFaCYY— Polkadot (@Polkadot) May 4, 2022
This now enables DOT users to mint and teleport NFTs between the parachains due to the upgrade of Statemint.
After passing community vote, v0.9.19 has been enacted on Polkadot. This upgrade included a batch call upgrading Polkadot’s runtime to enable parachain-to-parachain messaging over XCM and upgrading #Statemint to include minting assets (like NFTs) and teleports. pic.twitter.com/uqIB5di2Q1
— Polkadot (@Polkadot) May 4, 2022
All in all, Polkadot is developing into one of the safest and most promising crypto ecosystems in the long run. Hence, even though some technical indicators showcase bearish signs, DOT could easily overcome that with its exciting fundamentals.