


DOT Technical Analysis – February 2022
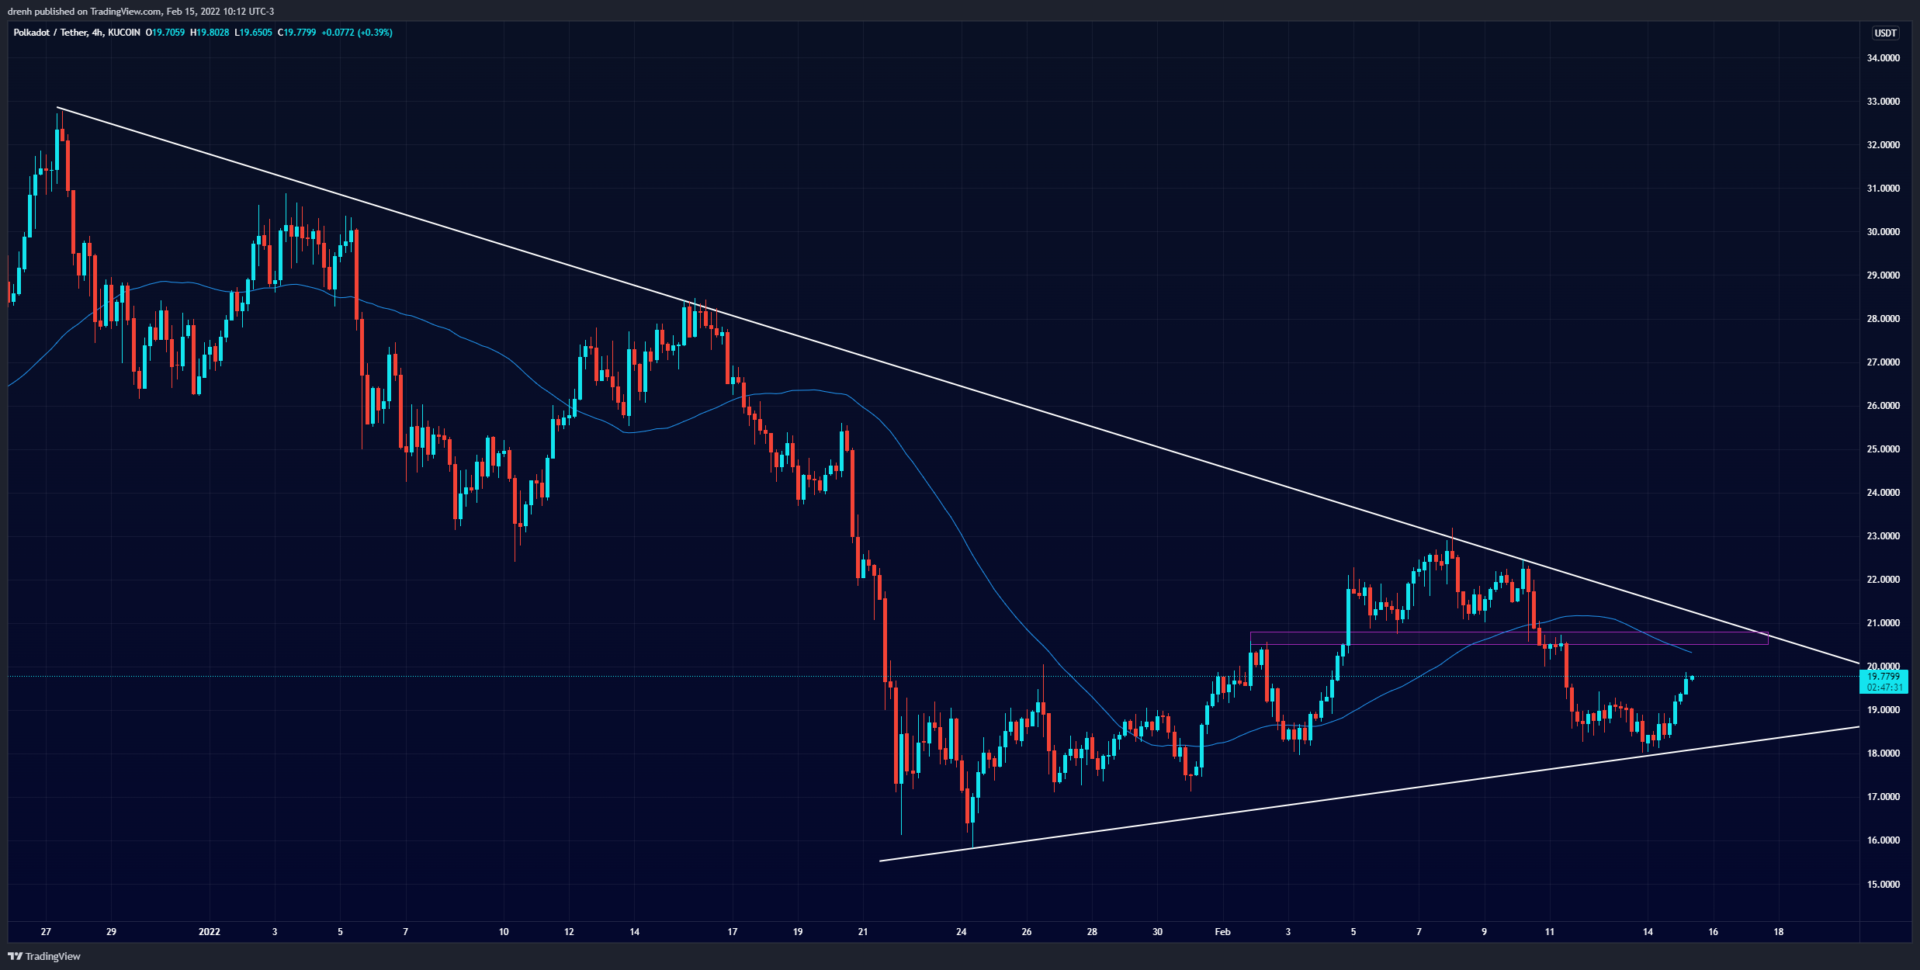
Polkadot (DOT) reached its all-time high in November of 2021, at a price of around $55. After that, the price entered a bearish run. It declined as low as $23 in the next few weeks, with a decline of around 58%. After finding support in that area, the price had a correction of 40%, but it faced resistance at $32. The price started declining once again.
Midway in January, after facing resistance at $28, the price had a bearish surge of 45%. The price of DOT then found support at $16, and it has been correcting ever since. DOT grew by 45%. It recently faced resistance at $23, which was a previous support structure,
Dot then declined again to $18, creating a higher low and hinting at a possible reversal. Nonetheless, DOT remains bearish even though the 4-hour chart shows bullish tendencies. Judging by the price pattern, a triangle pattern that took shape could see DOT have a breakout as the triangle gets narrower.

Key Structures
Support
- $18
Resistance
- $20
Indicators
Moving Average
The 50-MA of a 4-hour chart is still above the price of DOT, suggesting that the overall trend is still bearish and that the price of DOT could decline in the coming weeks. The 20-MA of a 4-hour chart, however, is now below the price, indicating that the short-term trend is bullish and that DOT could increase in the coming days.
The 9-EMA of a 4-hour chart is also currently below the price, indicating that the shorter-term trend is bullish and that the EMA line could act as support to the price of DOT.
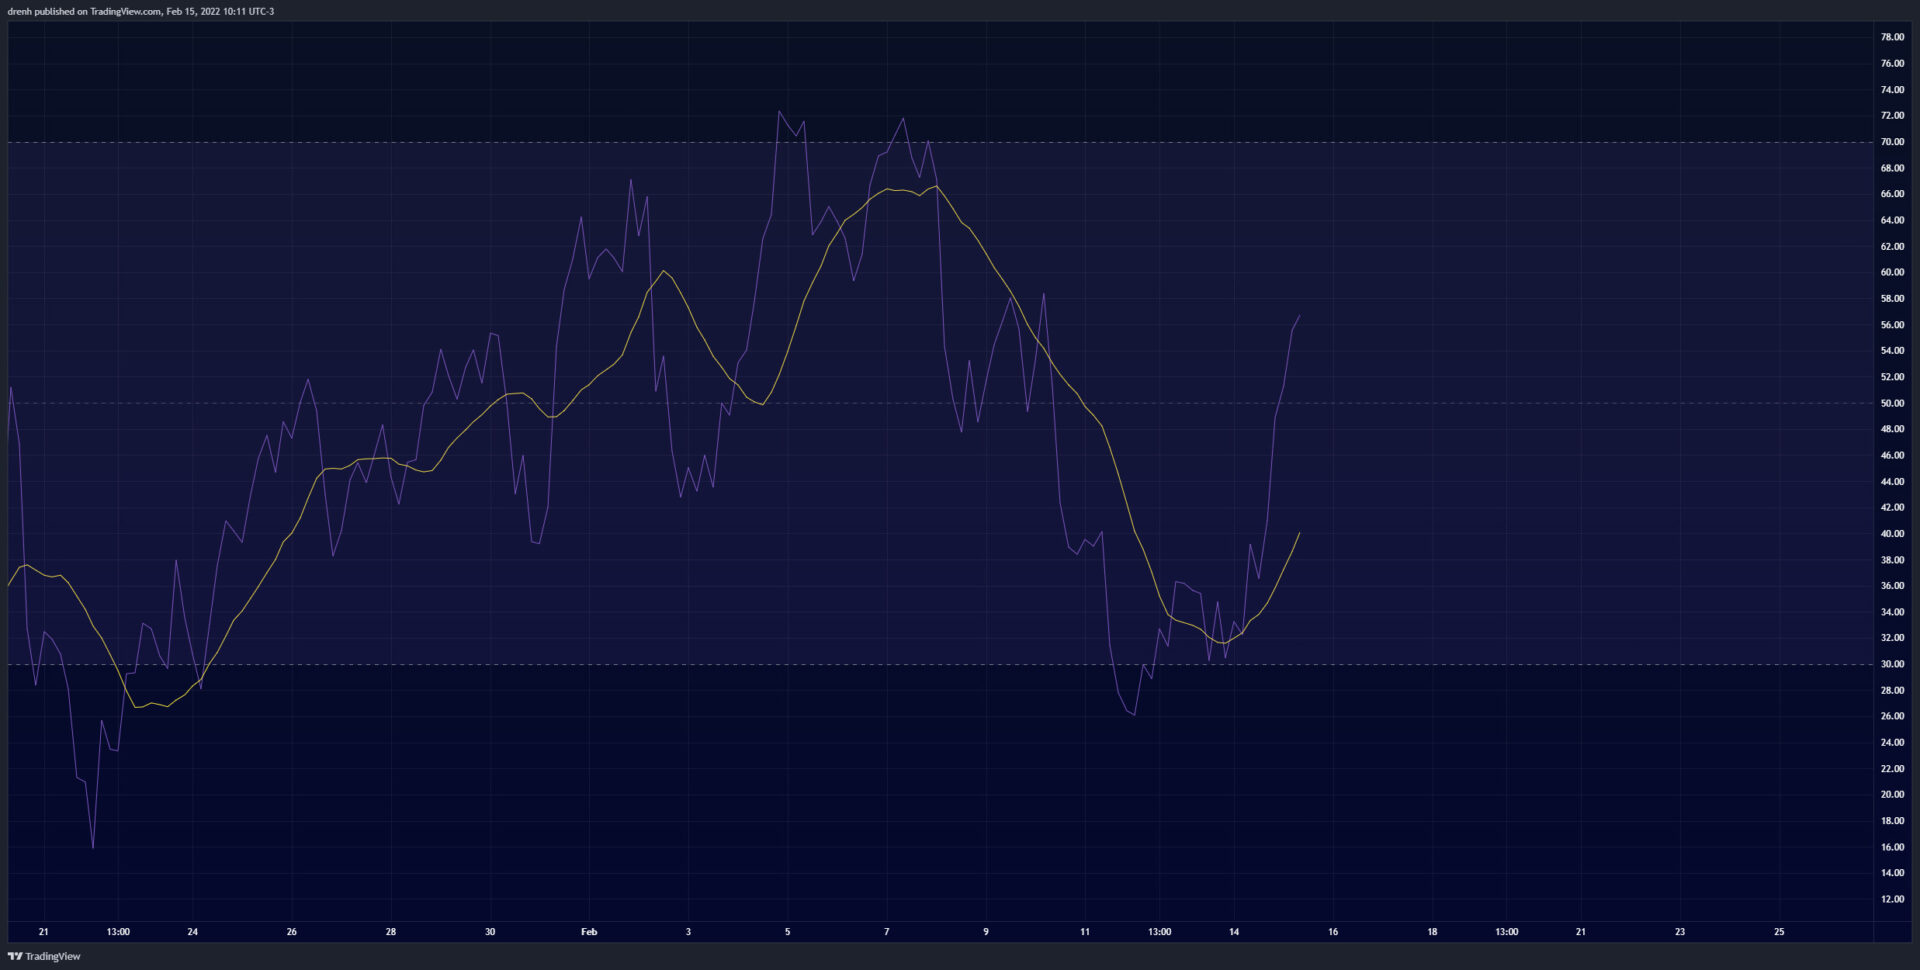
Relative Strength Index
The RSI of a 4-hour chart was recently below 30, indicating that DOT became oversold. Hence, the recent increase was anticipated. The RSI is now approaching 70, and it indicates that there is a lot of buying pressure for DOT in the 4-hour chart.
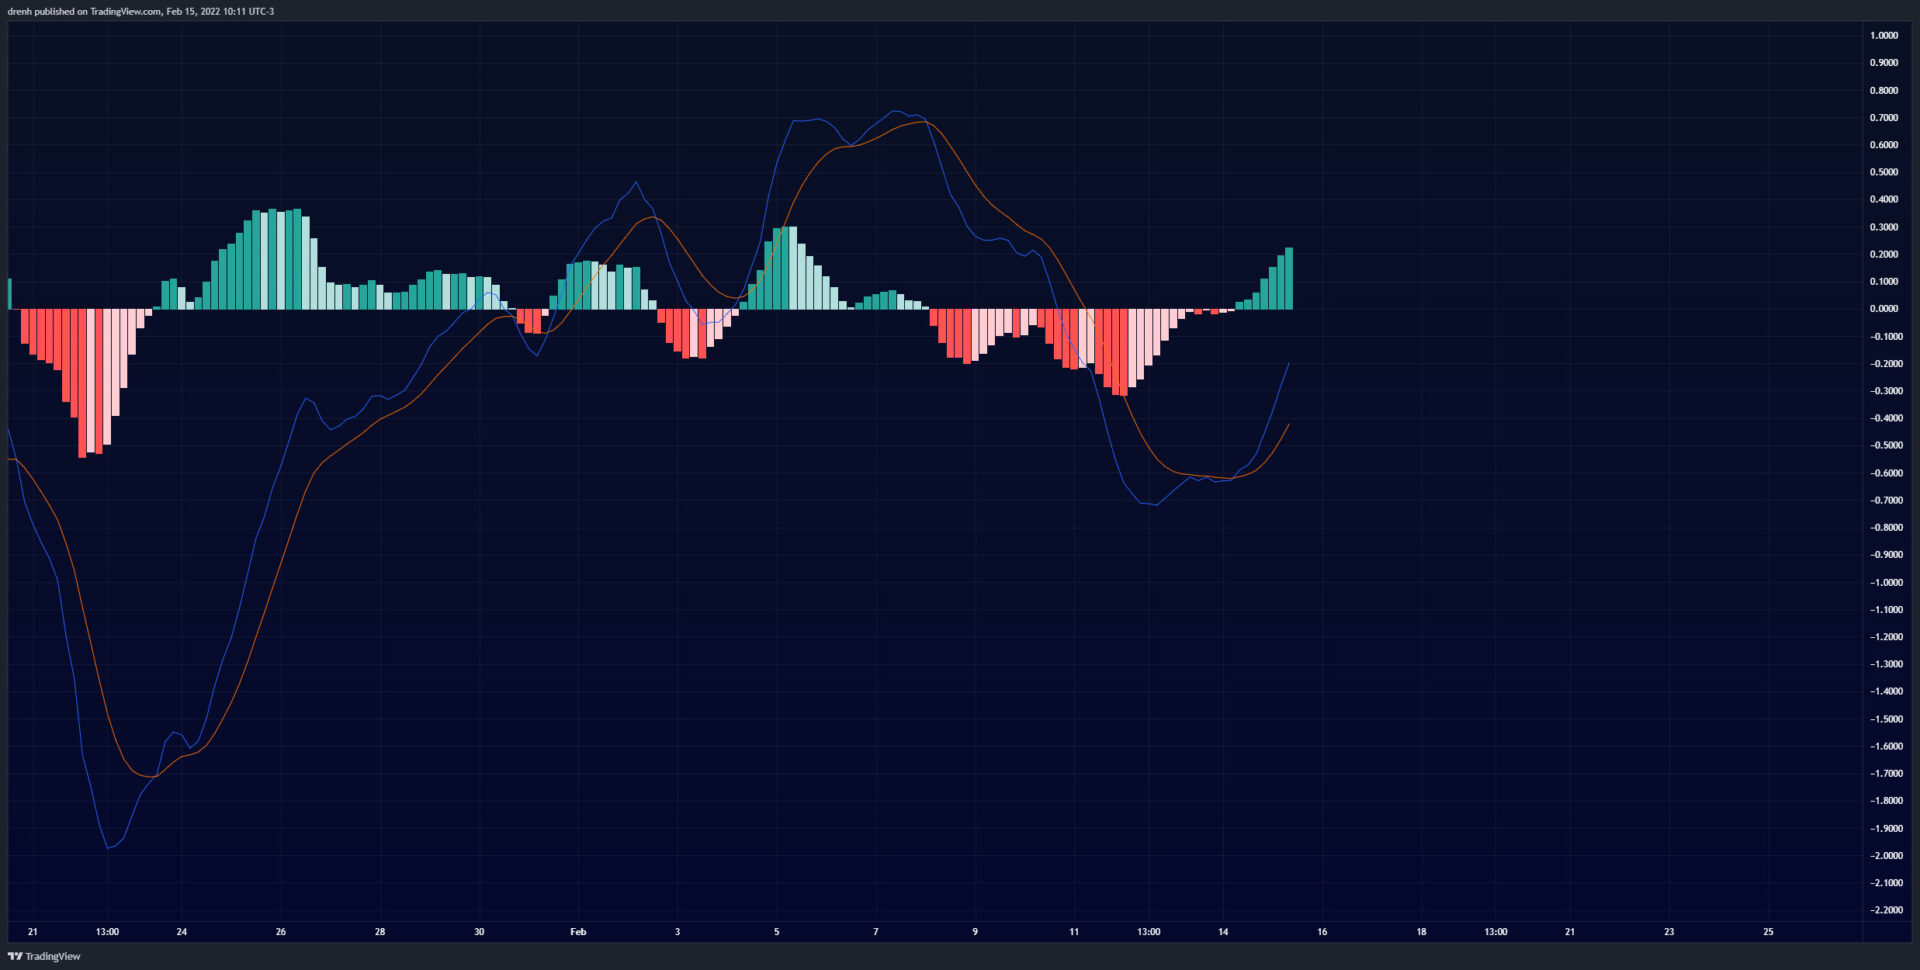
MACD
The MACD line of a 40hour chart is above the signal line, meaning that the momentum is bullish. Nonetheless, it is still below the baseline, so this momentum should continue for DOT to have a chance for a reversal.
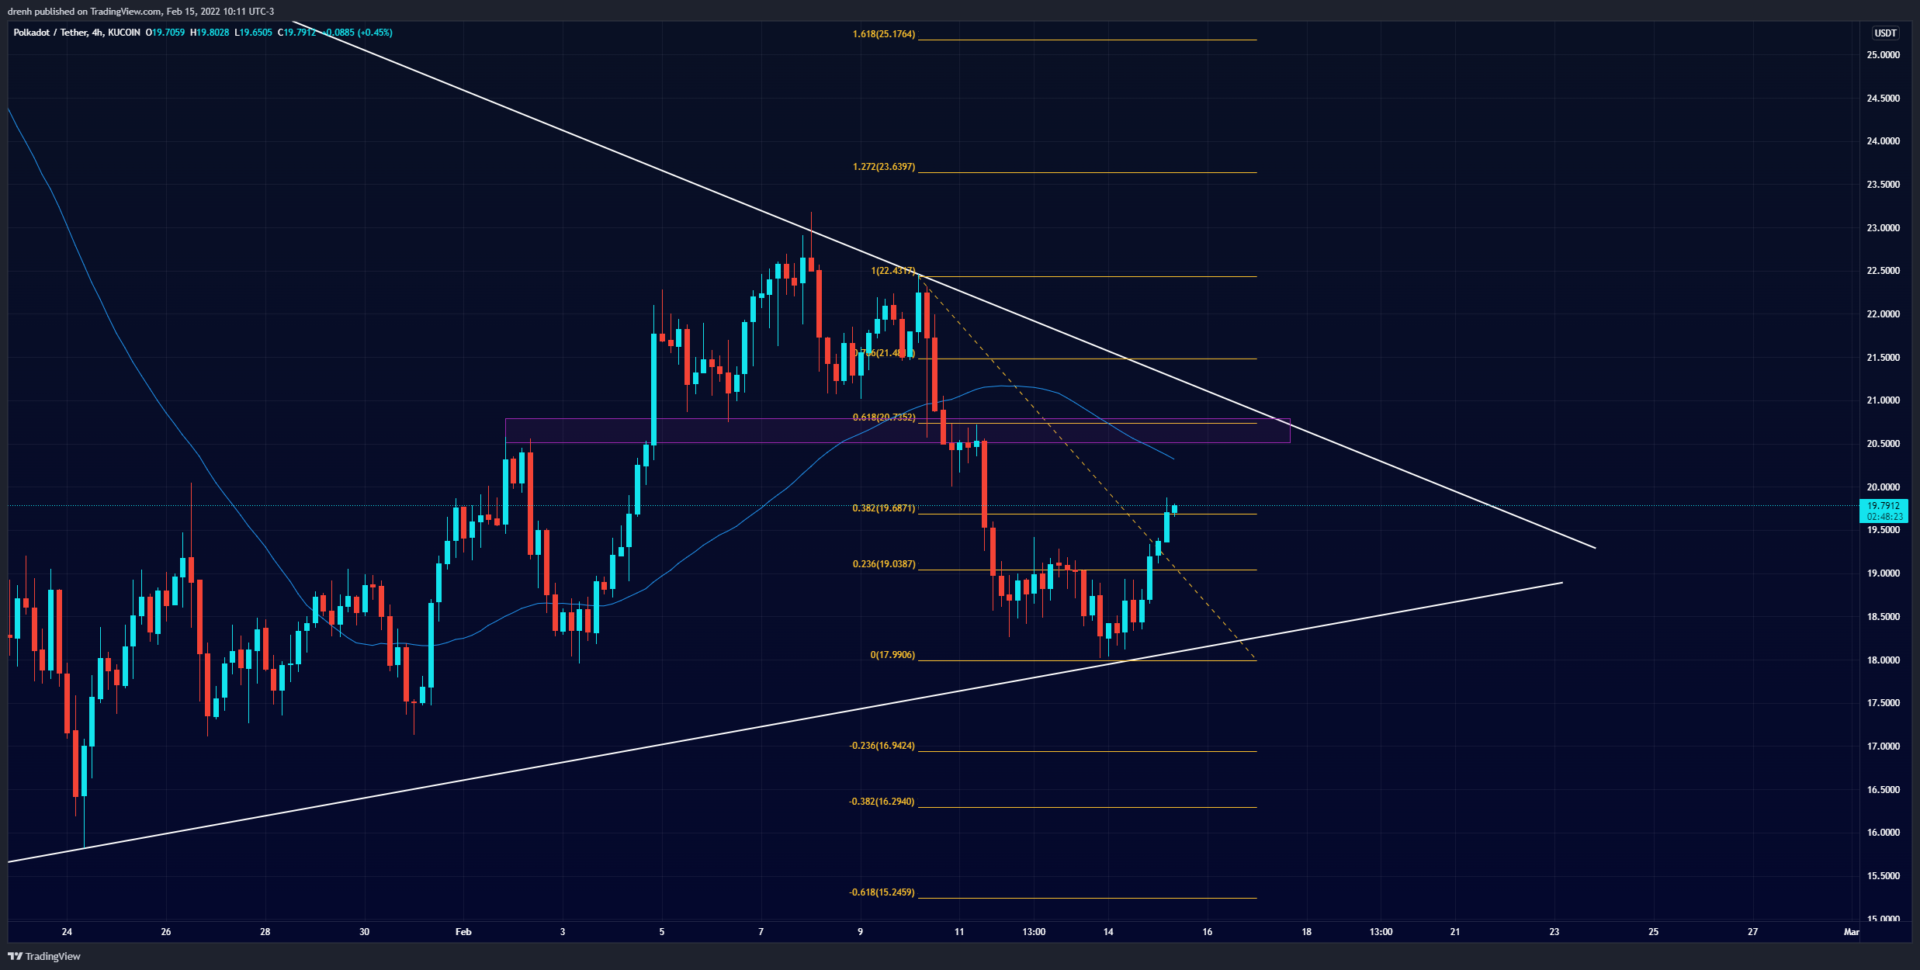
Fibonacci
The Fibonacci retracement levels of a 4-hour chart suggest that the price of DOT may face resistance at the 61.8% level, where it also coincides with previous resistance levels. If DOT fails to break that level, then the price could retrace further down to the projected support.
Price Prediction DOT – February 2022
Based on this technical analysis on Polkadot (DOT), the price of DOT could keep increasing in the short run. It may face strong resistance at $20, which could prove to be crucial for the coming weeks. If DOT manages to break that level, then it could reverse the trend and aim higher in the coming weeks. The price could go as high as $30 in February. However, if it fails to do so, then the price could retrace and find support at around $18. Nonetheless, a breakout could occur. Judging by the recent head and shoulders pattern, the neckline also coincides with our projected resistance. Hence, breaking that structure could prove to be key for Polkadot.
Latest News for DOT – Affecting Price
Recently, both Cardano and Polkadot have been approved to be traded in the Frankfurt Stock Exchange in Germany. With both DOT and ADA now as Exchange-traded products (ETPs), their accessibility vastly increases. Furthermore, the demand for ADA and DOT can now greatly increase, leading to an increase in the price.
In other news, Polkadot has also recently announced that HydraDX has won the 9th auction. With the parachains making Polkadot an ecosystem of the future, we could see such news to have an effect on the price of Polkadot in the coming weeks/months.
Congratulations to @hydra_dx on winning Polkadot’s 9th auction!
HydraDX will be onboarded at block #9,388,800 [roughly March 11,2022] at the beginning of lease 7 with the other winners from auctions 6-11. Over 5.3K network stakeholders locked up DOT in favor! pic.twitter.com/x3wMkMDKA9
— Polkadot (@Polkadot) February 10, 2022