


Polkadot came as the new advent in the consensus mechanism, quickly rising to power owing to the global anti-money laundering policies. Our Polkadot price analysis reveals that the cryptocurrency is rooting to break past the $10 mark and maintain the high. The proof of authority-based cryptocurrency stands for its authority on the ranking charts at number 10, enjoying the 10th largest market capitalization.
DOT price reached the year-to-date (YTD) high on the 2nd of January, just like the Binance Coin and Solana, the top three contenders to break past the top 5 ranking mark on the charts. In a similar movement, the price fell within a week to the $16 range. Just like Solana, DOT price also saw a rise to $23 in April to fall back down below the $20 mark in May.
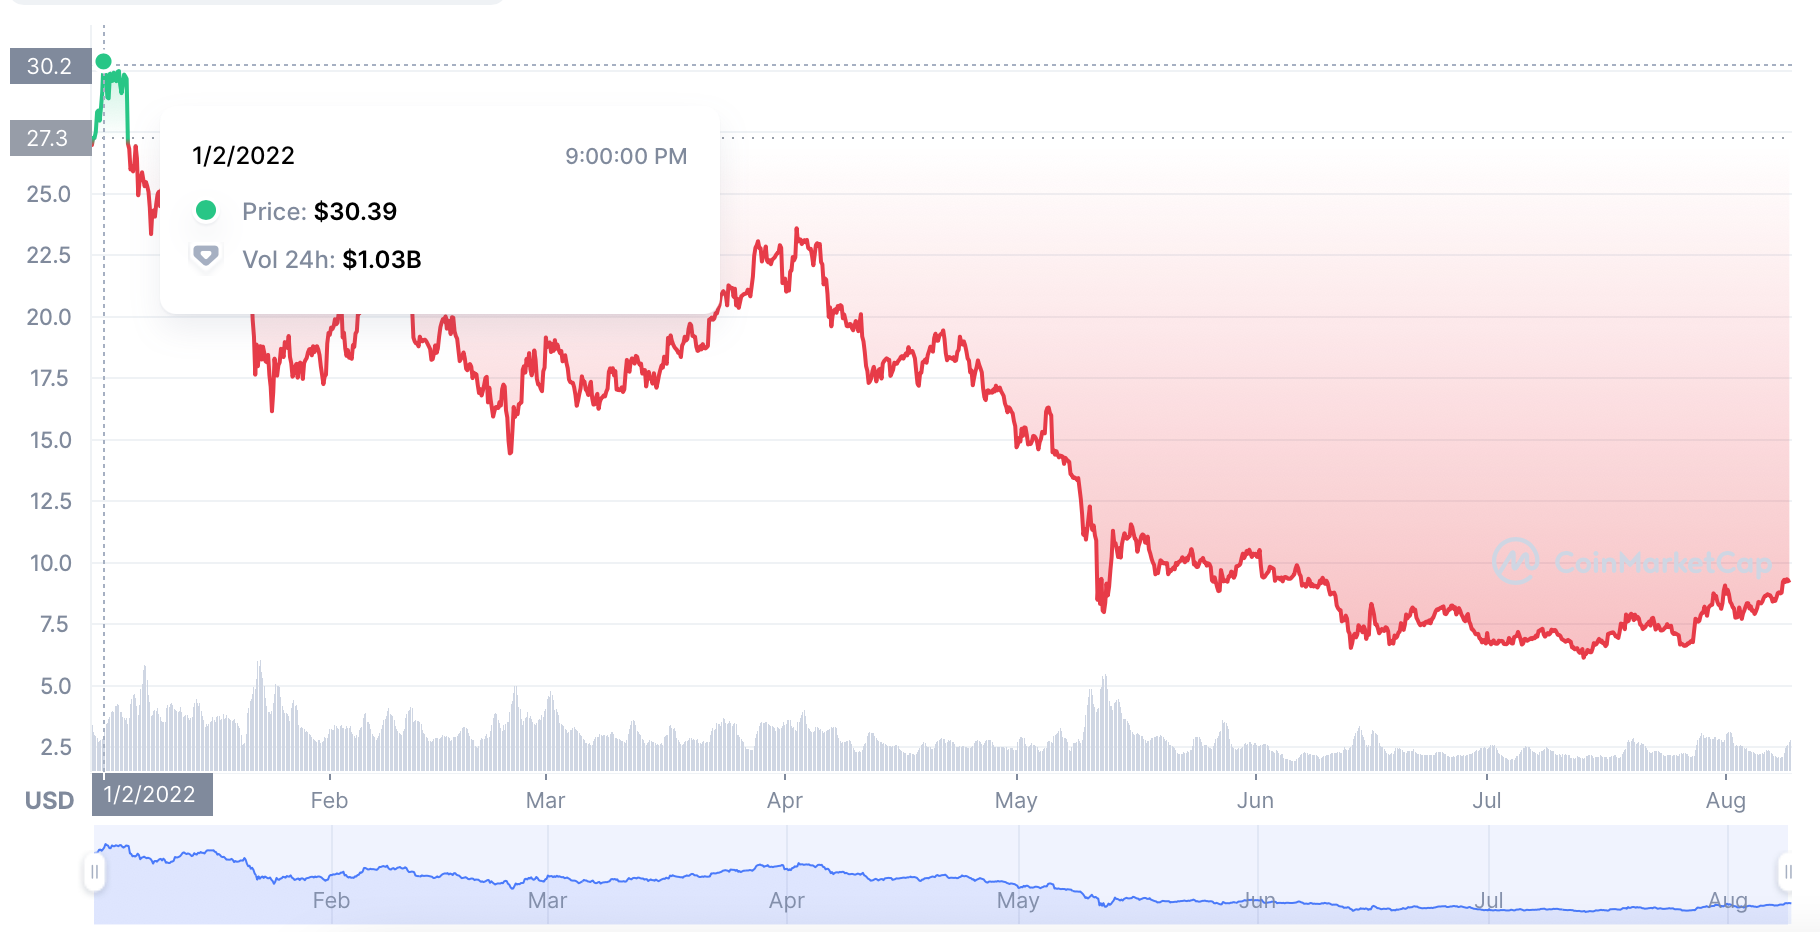
Polkadot price chart by CoinMarketCap

Since April 2022, Polkadot price has been following the market trend with a near identical price movement as the other top rated cryptocurrencies and tokens. The bearish trend is finally breaking as the Q4 approaches and Polkadot being a Web3 Foundation lead project enjoys some level of stability in its brand placement.
Polkadot Price Analysis: DOT stabilizing after rise, $10 likely
The original proof of authority cryptocurrency saw a small flash rise in the hours prior to writing and has been more stable than other cryptocurrencies in the top 10 list. The DOT price jumped from $8.30 to the $9.30 range in the early hours of 8th August 2022.
The flash rise happens at the same time as the relative strength index (RSI) showcases an oversold score of 86.33, indicating high DOT purchase volume. It is very likely that an institutional whale moved into the Polkadot investments pushing the price up; nevertheless, the news is good for day traders and hodlers alike.
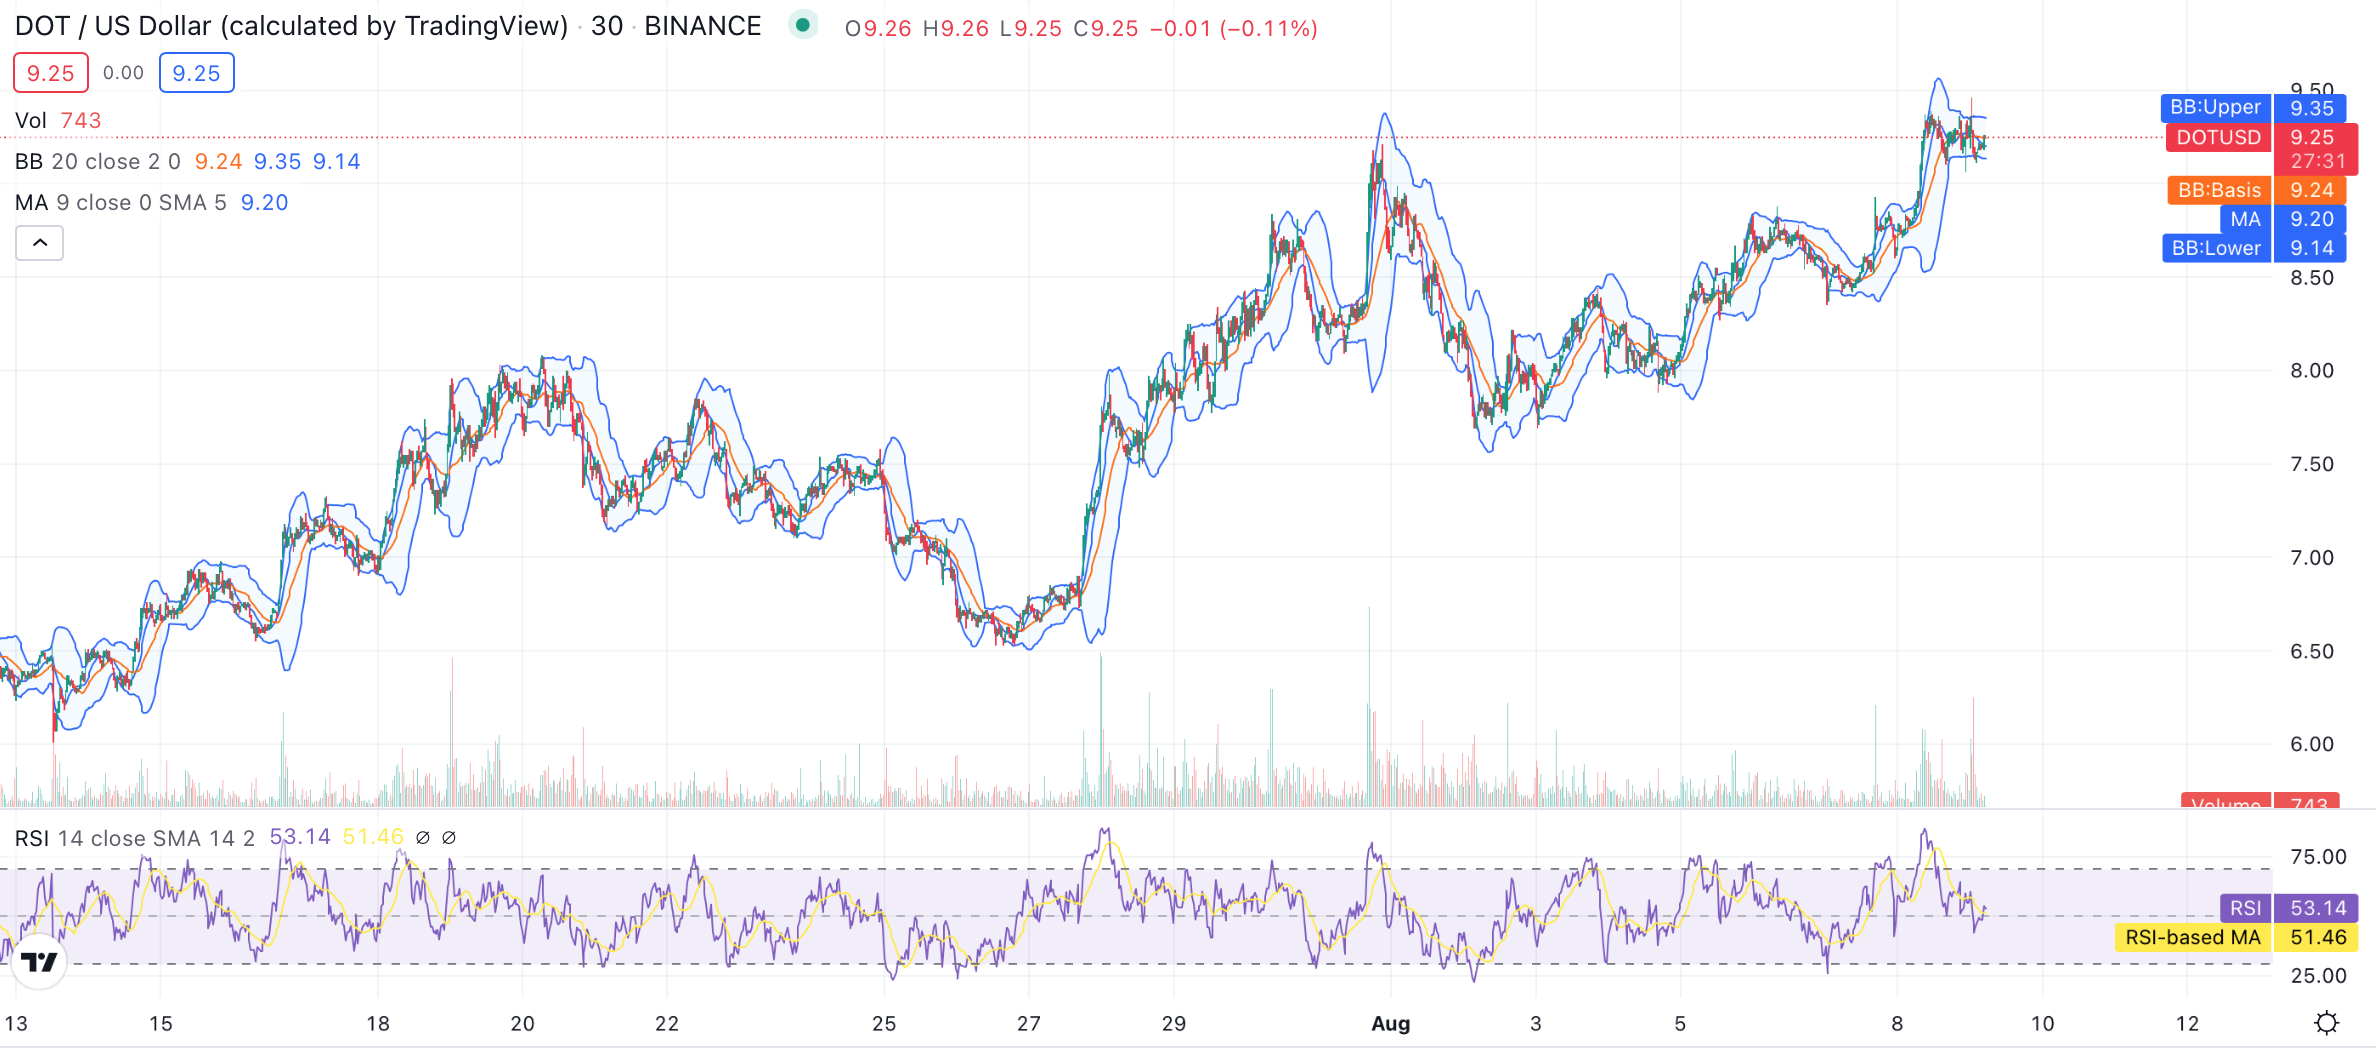
Polkadot price analysis chart made with TradingView

Polkadot is enjoying good levels of support after small corrections since the flash rise in the price, and the RSI is also indicating a stable score of 51.46. The RSI score is also quite close to the monthly RSI moving average (MA) found at the 53.14 mark. DOT price displays a more stable price movement, but the overall buy/sell trend owing to global inflation is apparent on the RSI chart, with both the oversold and overbought threshold lines touched briefly in the past week.
At the time of writing, the DOT price stands at the $9.25 mark enjoying three levels of strong support. The Bollinger Band average (BB: basis) presents the first support level at the $9.24 mark, while the moving average (MA) presents the second support level at the $9.20 mark. The Bollinger Band lower limit is presenting the strongest support at the $9.14 mark.
Bollinger Band upper is the only resistance indicator at the time of writing, present at the $9.35 mark, and any more strong buying trends in the coming week can throw the price up to the $10 level. Once the $10 high is breached, the DOT price is primed to maintain the $10 high unless a major market event sways the price movement.
Take Aways
- Polkadot price see $1 flash rise on the 8th of August.
- DOT maintaining the flash rise, institutional investment likely.
- DOT price is priming to breach the $10 high.
- DOT is primed to maintain the $10 high once achieved.
Disclaimer: The information provided on this page is most accurate to the best of our knowledge; however, subject to change due to various market factors. Crypto-Academy encourages our readers to learn more about market factors and risks involved before making investment decisions.