


HERO Technical Analysis – December 2021
Monthly Analysis
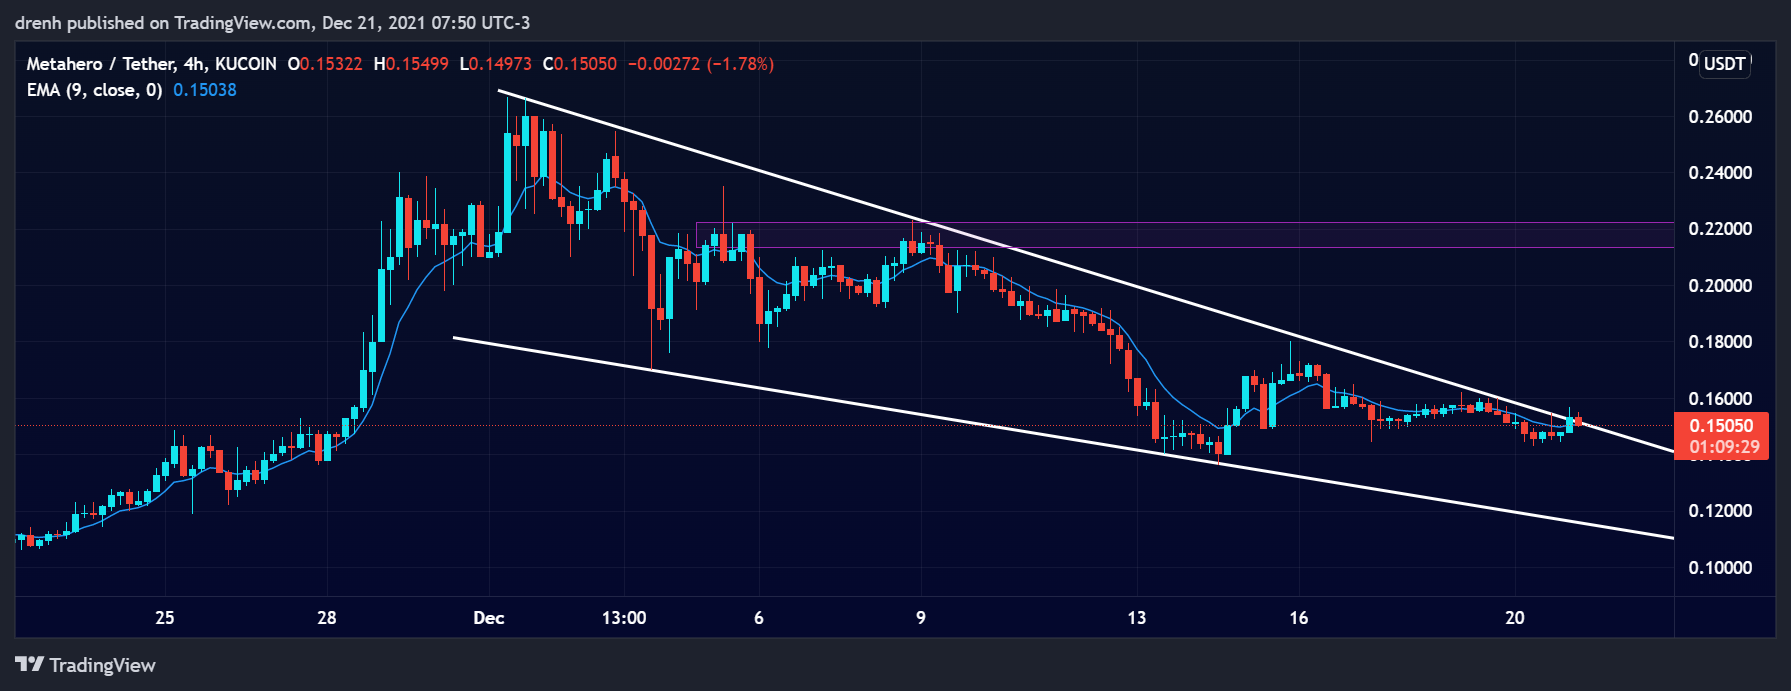
In the last 30 days, HERO was initially quite bullish. The price increased by around 200%, where it reached a new all-time high at around $0.26. After that, the price started declining as the market itself began declining. The price has dropped by around 50% so far, indicating that the price could now be in a downtrend in the 4-hour chart.

Weekly Analysis
In the last 7 days, HERO had a correction of around 30%, but it faced resistance at $0.18. The price declined by around 20% after that, and it recently found support at $0.14. The price has recently been showing signs of improvement as it is currently attempting to break the upper trend line in the 4-hour chart.
Daily Analysis
In the intraday chart, HERO has been quite bullish as the price has increased by around 7% in the last few hours. Nonetheless, the price is currently retracing and it may continue declining in the intraday chart.
Key Structures
Support
- $0.14
Resistance
- $0.17
Indicators
Moving Average
The 20-MA line of a 4-hour chart is currently slightly below the price of HERO due to the recent upward price movement of HERO. This could see the trend reverse and head upward in the coming days, as HERO could regain its bullish momentum.
The 9-EMA of a 4-hour chart is also currently above the price, suggesting that the trend is reversing and that the price of HERO may now be bullish. The EMA line could now act as support to the price if it attempts to decline in the short run.
Relative Strength Index
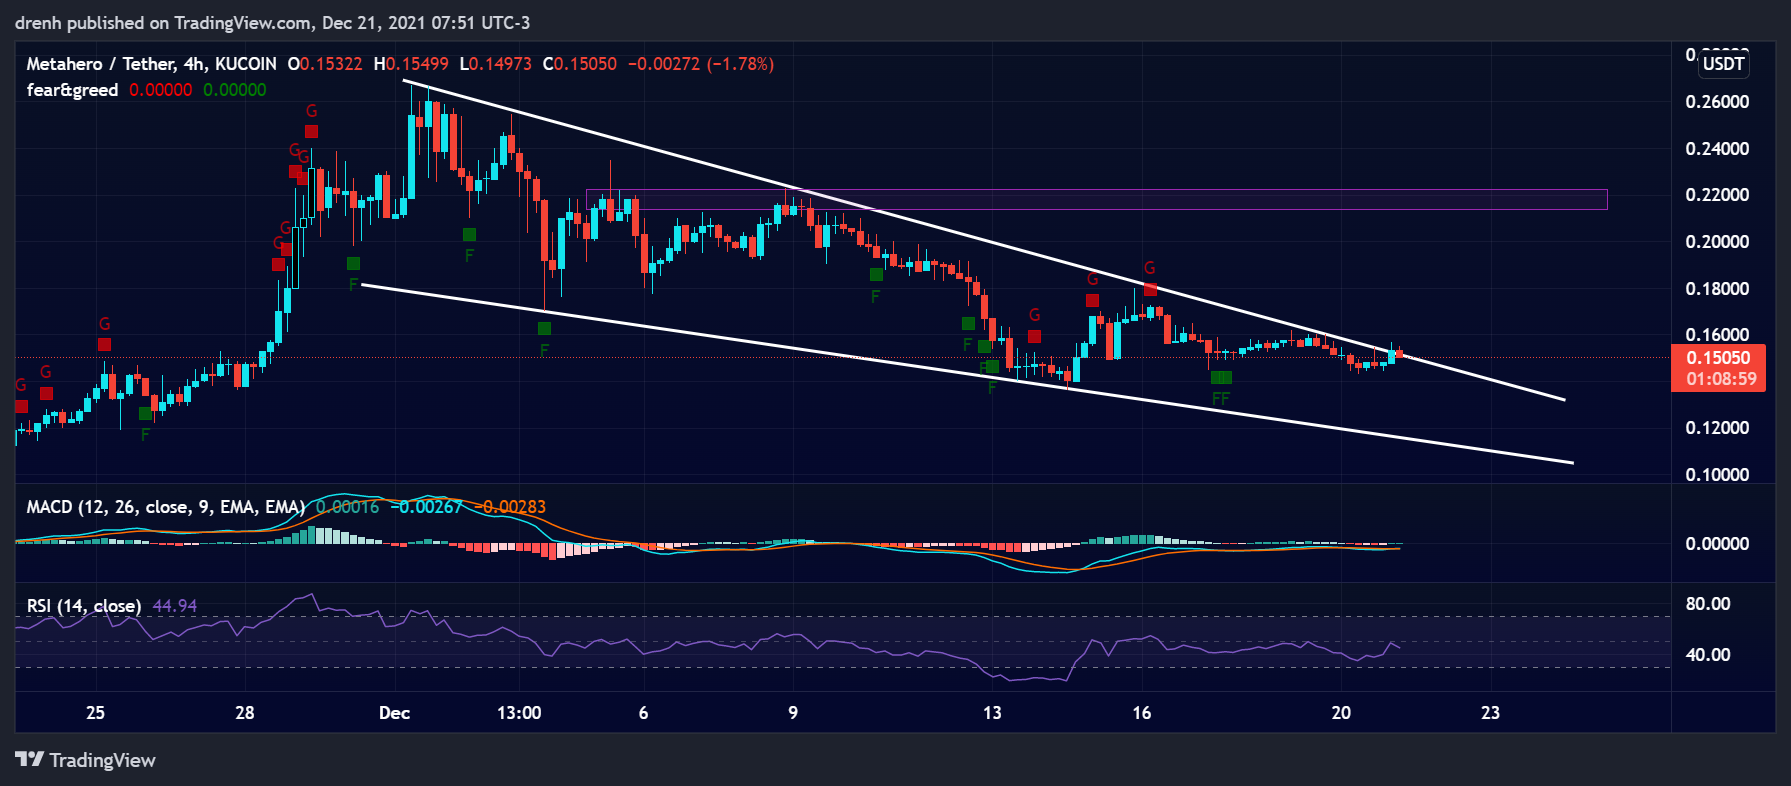
The RSI of a 4-hour chart is within the 30-70 range, indicating that there is plenty of room for HERO to increase. Nonetheless, the RSI is still below 50, meaning that the selling pressure is still high for HERO.
MACD
The MACD line of a 4-hour chart is below the baseline, and it has recently converged with the signal line, where the latter is above the MACD line. This could see the momentum continue to be bearish in the 4-hour chart for Metahero, as the price could keep declining.
Fear & Greed
The fear and greed indicator of a 4-hour chart suggests that the current emotion of HERO traders is fear, meaning that HERO is bearish. It may soon turn into greed if the trend reverses as projected.

Fibonacci
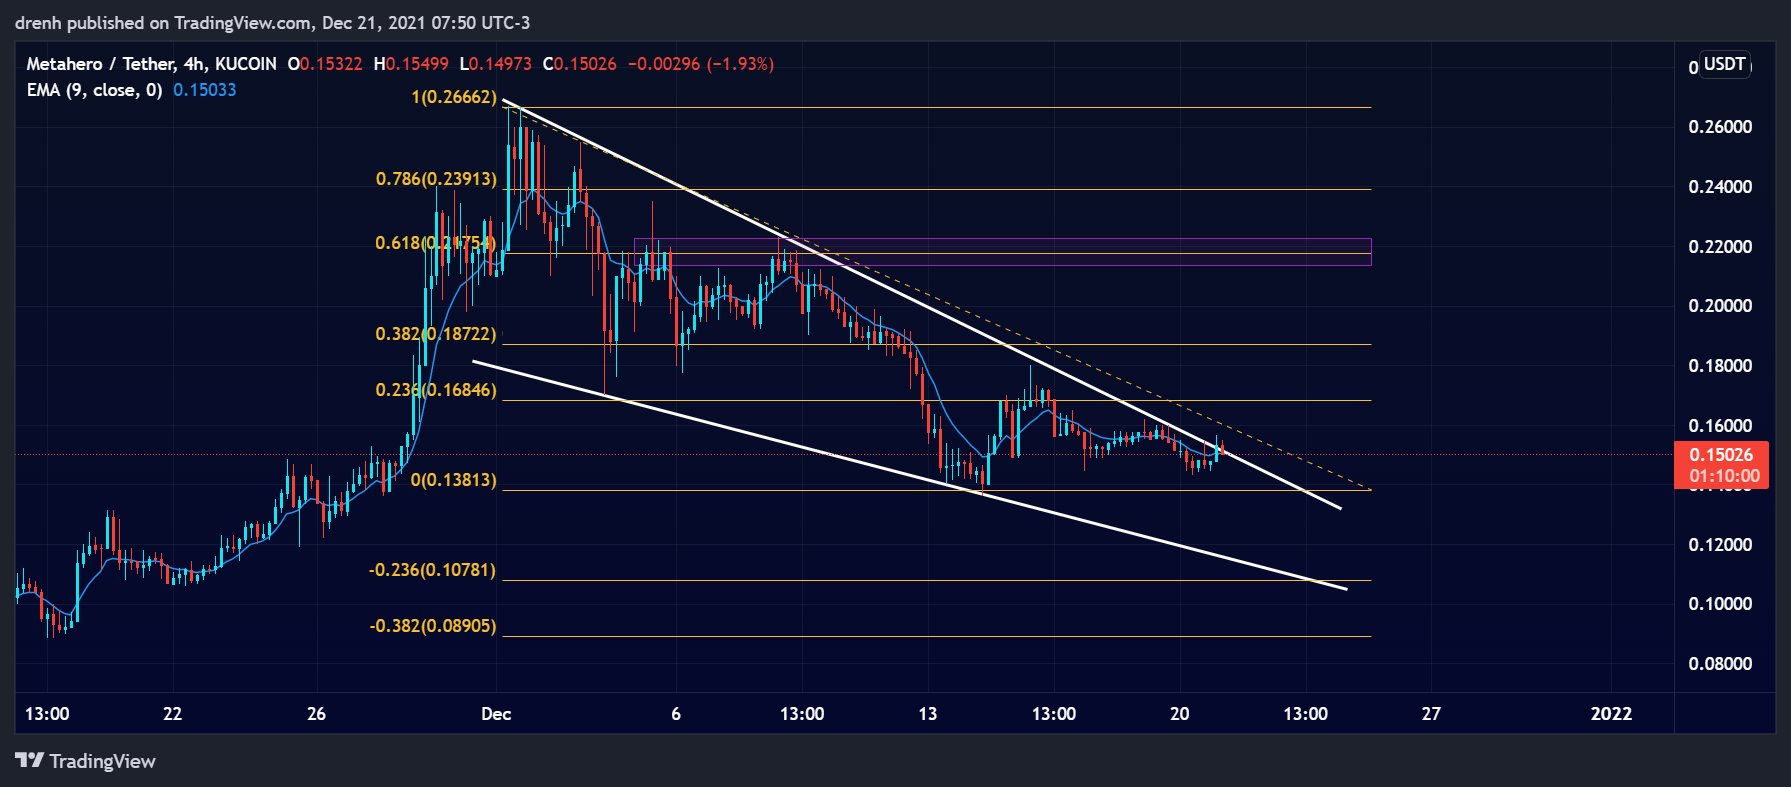
The Fibonacci retracement level of a 4-hour chart suggests that if the support at $0.138 was strong support to rebound, the price could retrace to the 61.8% level, where it is expected to face strong resistance.

Price Prediction HERO – December 2021
Based on this technical analysis on Metahero (HERO), the price could break the upper trendline and attempt a reversal. The price then could surpass $0.20 in the short run where it may face strong resistance, other things equal. If the trendline is not broken, then the price could continue to decline in the downtrend. It may go as low as $0.10 in the short run.
Latest News for HERO – Affecting Price
Metahero was part of the Rich List Group in the F1 Racing events that occurred last week. This way, the token got exposure from multiple institutional investors, which could benefit the price of HERO in the longer term.
‘Max Verstappen partied with Metahero and The @richlistgroup in Abu Dhabi after clinching F1 championship’ writes @EsquireME
A man who takes our motto to heart.✊#BeYourOwnHero pic.twitter.com/O46fkkG2Ou
— Metahero.io (@Metahero_io) December 16, 2021
Furthermore, with the upcoming Everdome project, Metahero could explode in the coming months as the hype around Metaverse-related project intensifies.
Also read:
Metahero Price Prediction 2022 and Beyond – Can HERO Eventually Reach $1?
Metahero Review – Is Metahero a Good Investment?
Cryptocurrency and Metaverse – What is the Connection Between Cryptocurrencies and Metaverse?