


LTC Technical Analysis – September 2021
Monthly Analysis
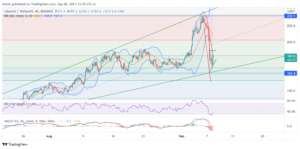
LTC reached a high of $232 over the last 30 days, after increasing by about 70%. After that, LTC started declining and went as low as $161 recently. This decrease alarmed investors that the bullish run might be over and that LTC might be in a downtrend. LTC has slightly increased to $189, but support levels are going to be key for determining whether this downtrend can continue.

Weekly Analysis
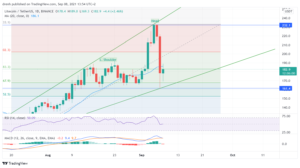
Over the last 7 days, LTC increased by about 40%, but then it was followed by a price decline of 30%. The short-run trend suggests that LTC is now bearish.
Daily Analysis
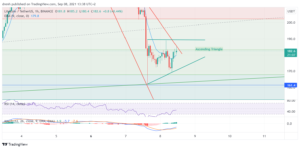
As for the intraday chart, LTC has been quite volatile and has slightly increased over the last few hours. An ascending triangle pattern has emerged in a 1-hour chart, where LTC might break above resistance in the immediate short run.

Key Structures
Support
- $161
Resistance
- $232
Indicators
Moving Average
Due to the recent and unanticipated price decrease of LTC, the 20-day moving average is now above the price and may act as resistance in the following days. Additionally, it suggests that the trend is now bearish. The 50-day MA is still below the price, so the longer-term trend might still be bullish for Litecoin and this MA may act as support.
The 9-day EMA is also above the price due to the recent price decline. This is another indication that LTC might be bearish for the coming days of this month.
Relative Strength Index
One way to explain this recent price decline is the RSI, which went over 70, making LTC overbought. Consequently, traders were alarmed and started selling LTC as soon as possible, dropping its price to as low as $161. Currently, the RSI is around 50, indicating that LTC now can both grow or go lower.
MACD
The MACD line and the signal line have just intersected, indicating that a shift in momentum is occurring and that sellers might take over. This might be a good indicator to let traders know that the price might go further down.
Fibonacci
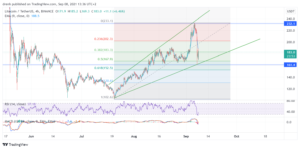
Looking at the Fibonacci in the longer term, the 38.2% level of support was broken. It remains to be seen whether the 61.8% can act as support in the coming days.

Drawing the Fibonacci levels in the shorter term, we can see that the 38.2% might act as resistance in the coming hours for LTC as it recently has.
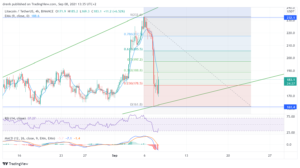

Rounding Top
The recent price movement of LTC has created a rounding top pattern. Since the neckline of this pattern was broken, then we might see LTC go further down in the upcoming days.
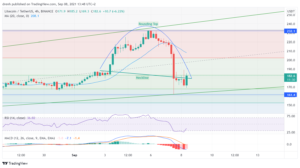

Potential Head And Shoulders
While it is never certain whether a pattern might emerge, we could see a head-and-shoulders pattern for LTC if the price is in consolidation in the following days. If that happens, then the right shoulder might form. Such patterns have bearish properties.

Price Prediction Litecoin – September 2021
Based on this technical analysis, we might see LTC retesting support at $161. If support is broken, then LTC might go further down to at least $145 in the coming days. If not, then LTC could climb up again.
Latest News for Litecoin – Affecting Price
Litecoin is the digital silver of the crypto market. Recently, institutional investors have had increased interest in Litecoin. One example might be Grayscale, one of the largest crypto investors in the world. This might explain why LTC increased over the last month in the way that it did.
Also read: What are the Advantages of Litecoin (LTC) Cryptocurrency?