
Litecoin Key Highlights
- LTC/USD has a target price of $220
- LTC price risks downtrend if it fails to break recent high
- Litecoin in downward correction fluctuates between $164 and $190
Litecoin (LTC) Current Statistics as It Risks $170 Low
The current price: $179.04
Market Capitalization:$15,052,953,490
Trading Volume: $1,869,076,815
Major supply zonens: $200, $220, $240
Major demand zones: $180, $160, $140
Litecoin (LTC) Price Long-Term Prediction: Bullish
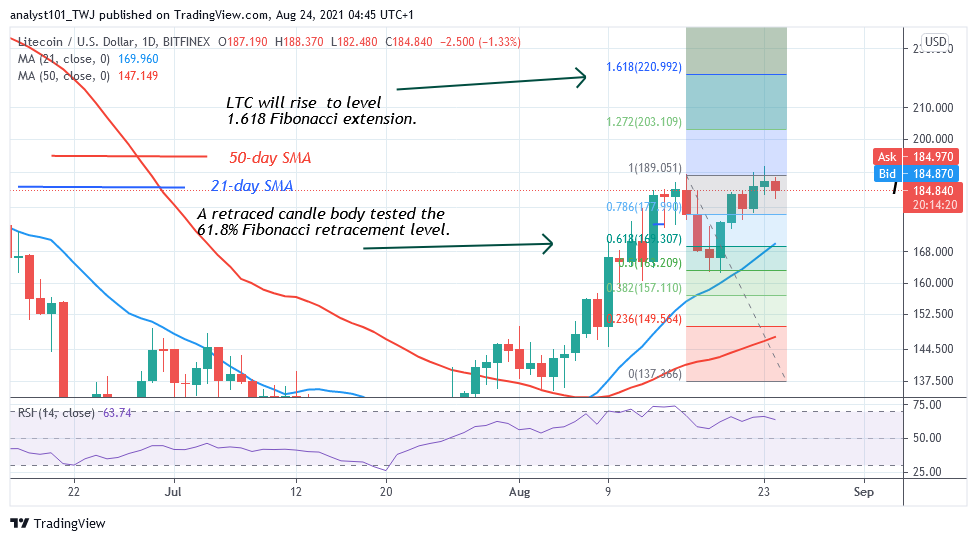
Since August 16, LTC/USD rallied and attained a new high of $189 as it risks $170 Low. The upward move could not continue because LTC prices reached an overbought region. Consequently, sellers push the price to $163 low on August 18. Buyers pushed LTC’s price to its previous high but could not sustain the bullish momentum above the recent high. For the past week, Litecoin has been in a downward correction. Today, altcoin is facing rejection at the recent high.
From every indication, Litecoin is likely to resume an upward move above the recent high. Meanwhile, on the August 16 uptrend, a retraced candle body tested the 61.8% Fibonacci retracement level. The retracement indicates that LTC will rise to level 1.618 Fibonacci extension or level $220.99. From the price action, LTC prices are fluctuating below the resistance level. Consistent consolidation below the resistance may lead to a breakout.

Litecoin (LTC) Indicator Analysis
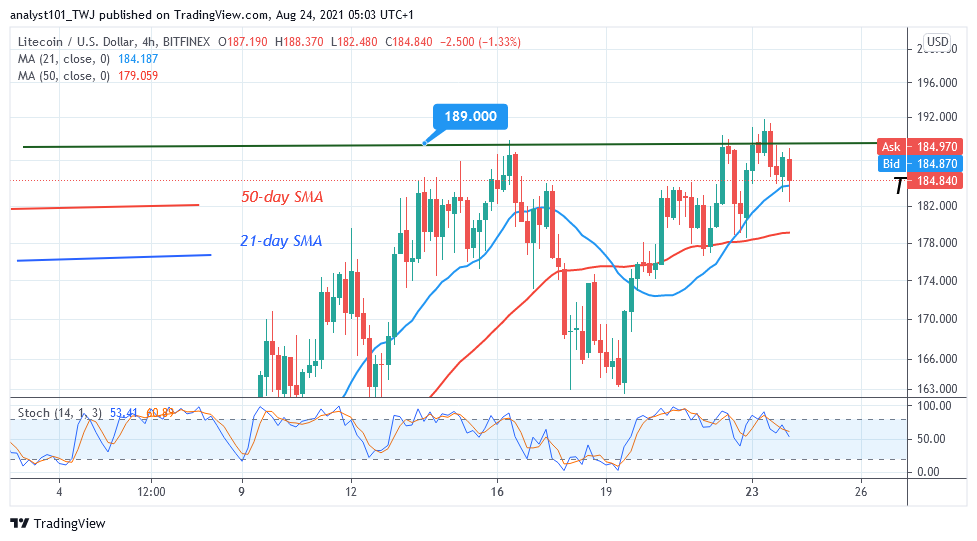
Litecoin is at level 64 of the Relative Strength Index period 14. It indicates that the crypto is in the uptrend zone and capable of rising on the upside. The altcoin is below the 80% range of the daily stochastic. It indicates that the market is in a bearish momentum. The horizontal line indicates that Litecoin is in a sideways move below the overhead resistance. The 21-day and the 50-day SMAs are sloping upward indicating the uptrend.
What Is the Next Move for Litecoin as It Risks $170 Low?
LTC/USD has been in a sideways trend since August 16 but It Risks $170 Low. The crypto is in a downward correction as it fluctuates between $164 and $190 The bulls have retested the overhead resistance thrice as the crypto was rejected. Nonetheless, the overhead resistance at $189 is likely to be weakened after several retests. A break above $189 high will accelerate price movement above the overhead resistance.
Read More: What are the Advantages of Litecoin (LTC) Cryptocurrency?
Note: Crypto-academy.org is not a financial advisor. Do your research before investing your funds in any financial asset or presented product or event. We are not responsible for your investing results.