


KCS Technical Analysis – October 2021
Monthly Analysis
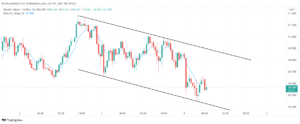
In the last 30 days, KuCoin has been bearish. Its price declined by around 39% in a period of two weeks. Then, KCS found support at $9.1. The price then increased by around 20%, but it kept declining after that. Recently, KCS has increased by 17%, but the price encountered resistance at $11.17.
Weekly Analysis
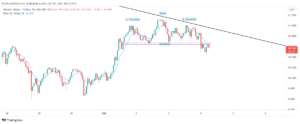
In the last 7 days, KCS increased by 17%. Beating the previous high, the trend suggested that it can keep going upwards. However, the recent price pattern has created a head-and-shoulders formation. With the neckline recently broken and then acting as resistance in the last few hours, KCS could be going further down.

Daily Analysis
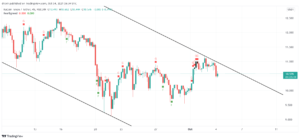
In an intraday char, KCS has been bearish. The shorter-term trend is bearish and the price failed to break resistance at $10.66 in a 30-minute chart.

Key Structures
Support
- $9.70
Resistance
- $11
Indicators
Moving Average
Due to the recent resistance and slight dip in the intraday chart, the 20-day moving average is now above the price. This could indicate that the trend might be downward in the coming days and that the MA line could act as resistance.
The 9-day EMA is still below the price and is currently acting as support to potential price decreases. The coming hours might be crucial to determine whether KCS has reversed or not.
Relative Strength Index
The RSI of a daily chart is slightly below 50, indicating that the momentum is bearish. Similar can be said about the 4-hour chart, but the RSI has been increasing in the last few hours.
MACD
The MACD line of a daily chart is above the signal line and above the baseline, indicating that the price could keep increasing in the coming days. As for the 4-hour chart, the MACD line is below the signal line and headed below the baseline.
Fear & Greed
The recent emotion for KCS traders in a 4-hour chart is greed, indicating that the buying pressure is a little higher. Nonetheless, that could soon shift to fear.

Fibonacci
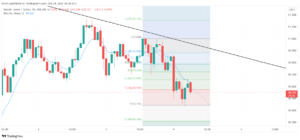
The Fibonacci retracement levels suggest that the price could retrace in the coming hours up to the 78.6% level, where also previous resistance coincides. If that occurs, then the price could eventually drop again to 0%.

Price Prediction KCS – October 2021
Based on this technical analysis on KuCoin, its price could decrease in the coming hours/days due to the recent head-and-shoulders pattern and the fact that KCS failed to break resistance again. The price could decline to $10.1 in the coming hours. Eventually, KCS might test support at $9.7 in the coming days.
Latest News for KCS – Affecting Price
KuCoin recently celebrated its 4th anniversary. This was a good day for the KuCoin community, and it could as well be attributed to the recent price increase. KuCoin remains a promising project and its price could soar upwards in the future.
Also read: KuCoin (KCS) Price Prediction 2021 and Beyond – Will KCS Overcome BNB?