

KCS Technical Analysis – October 2021
Monthly Analysis
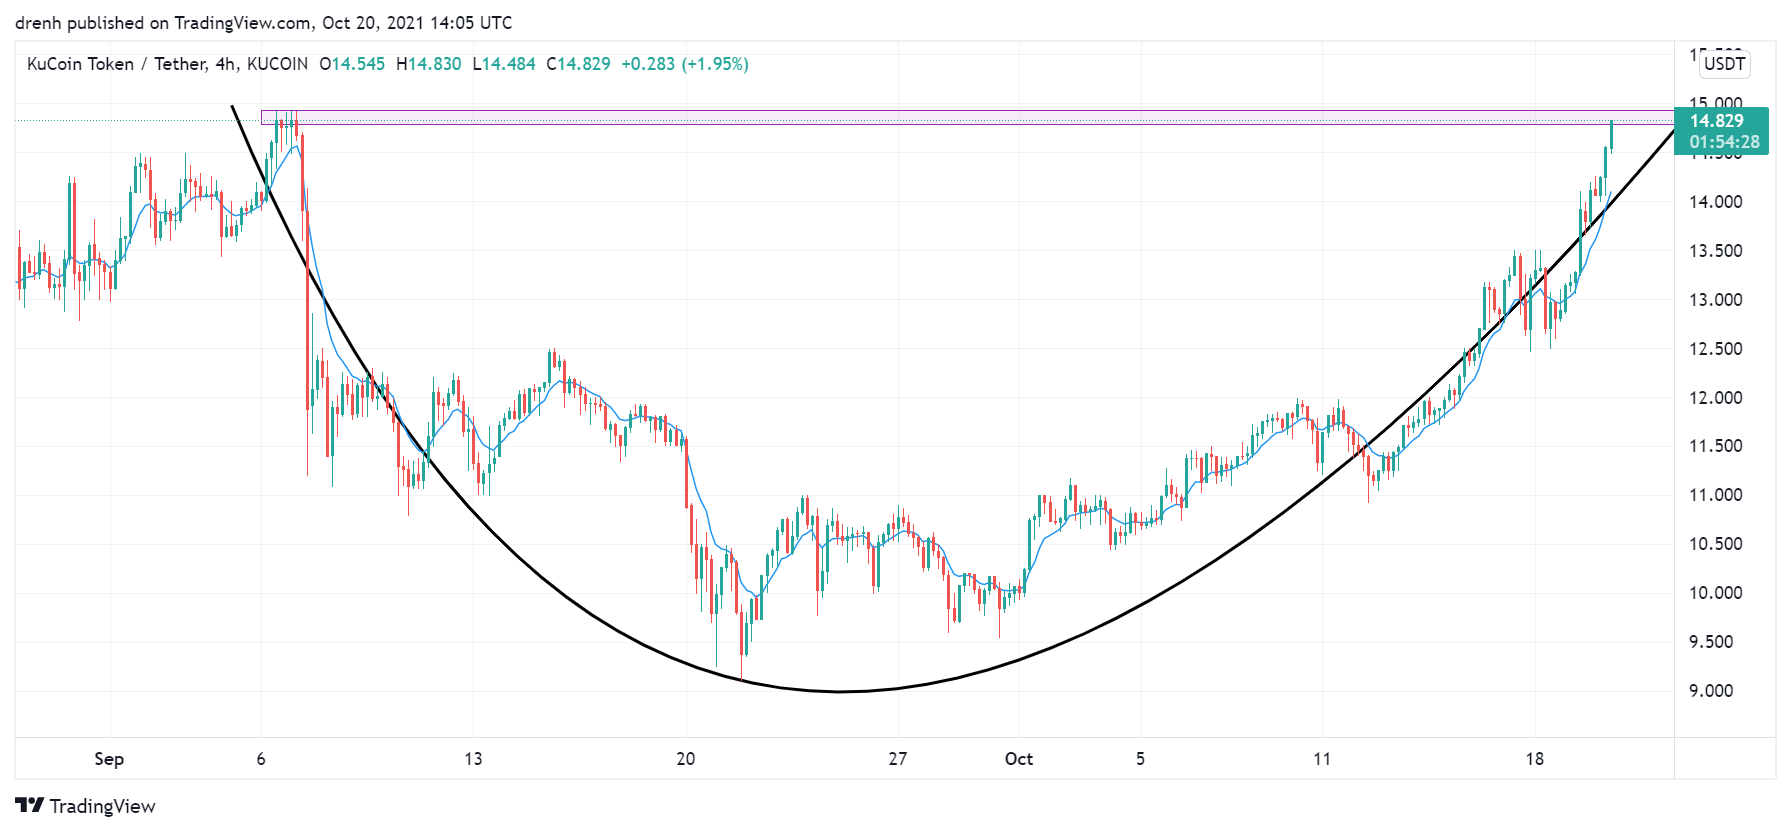
Over the last 30 days, KCS has increased by more than 60%. It has been bullish, and a rounding bottom pattern has taken shape. This indicates that the price could keep increasing in the coming days.

Weekly Analysis
In the last seven days, KCS has been bullish as well. The price has increased by around 33% in the last few days. The trend is upward, and the price of KCS could keep increasing in the coming days.
Daily Analysis
In the intraday chart, KCS has also been bullish. Its price has increased by 6% in the last few hours. Judging by the trendline, the price could keep increasing in the coming hours.
Key Structures
Support
- $12.5
Resistance
- $14.9
Indicators
Moving Average
The 20-day moving average is below the price due to the recent price increase. This indicates that the trend is upward and that the price could keep increasing in the coming weeks.
The 9-day EMA is also below the price, and it is currently acting as support for the price of KCS. It indicates that the price can keep increasing in the coming days.
Relative Strength Index
The RSI of a daily chart is over 70 and in the overbought region. This indicates that the price of KCS could pull back to be below 70 again. The same applies to the 4-hour chart, meaning that the price could decline in the coming hours.
MACD
The MACD line is above the signal line and above the baseline in a daily chart. This indicates that the momentum is bullish for KuCoin and that the price could increase in the coming days. The same applies to the 4-hour chart as well, as the price could increase in the coming hours as well.
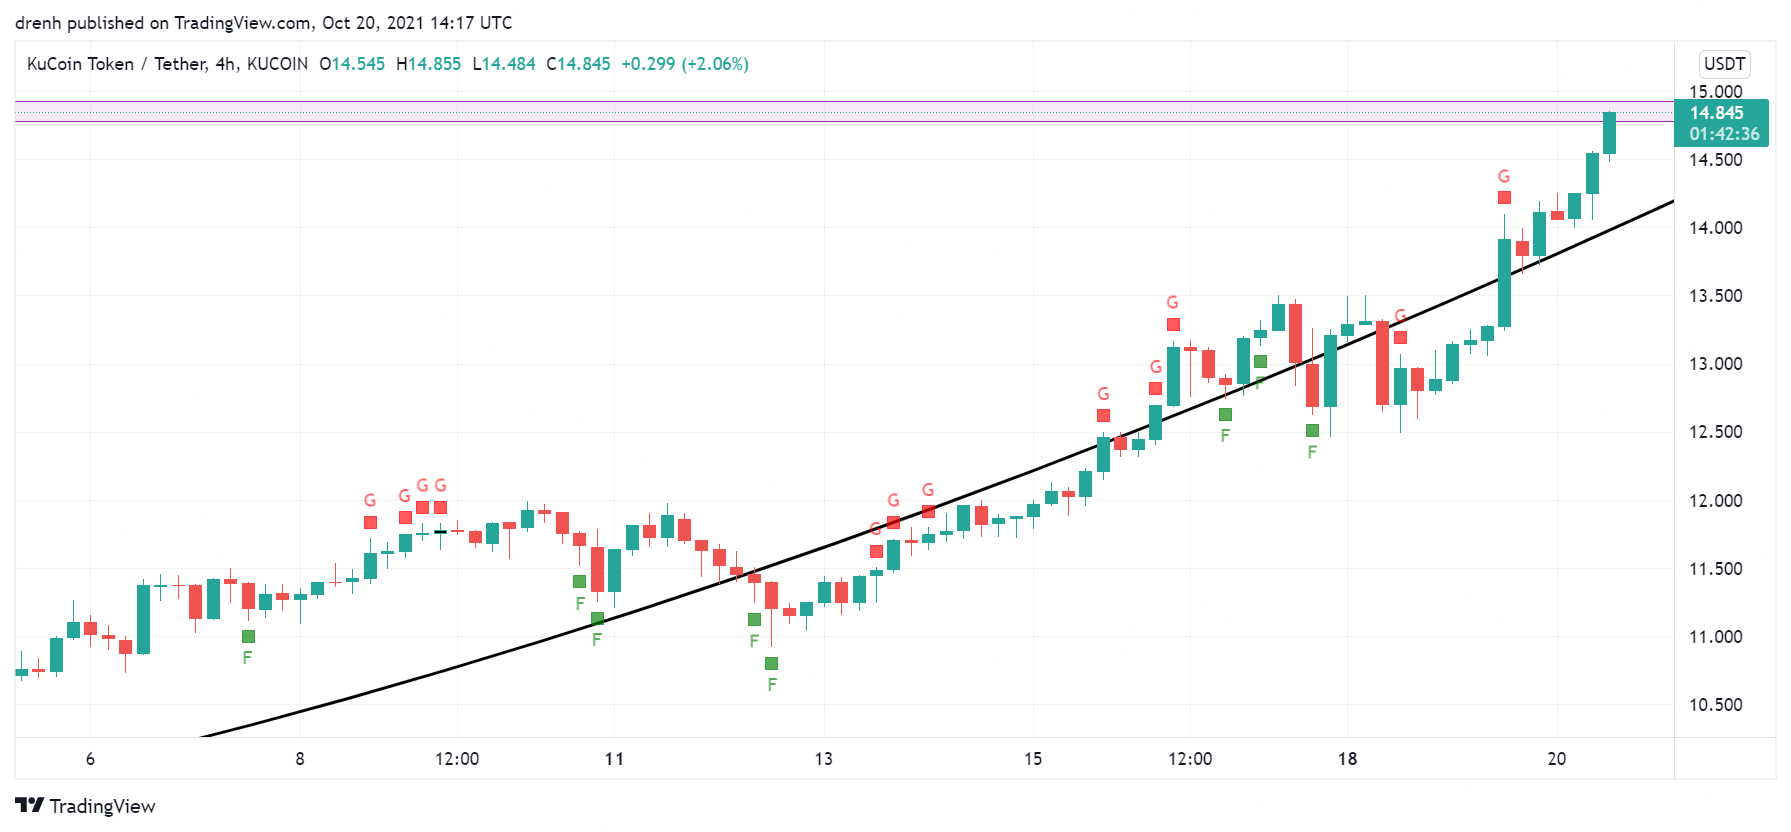
Fear & Greed
The fear and greed indicator suggests that the current emotion of KCS traders is greed due to the recent price increase.
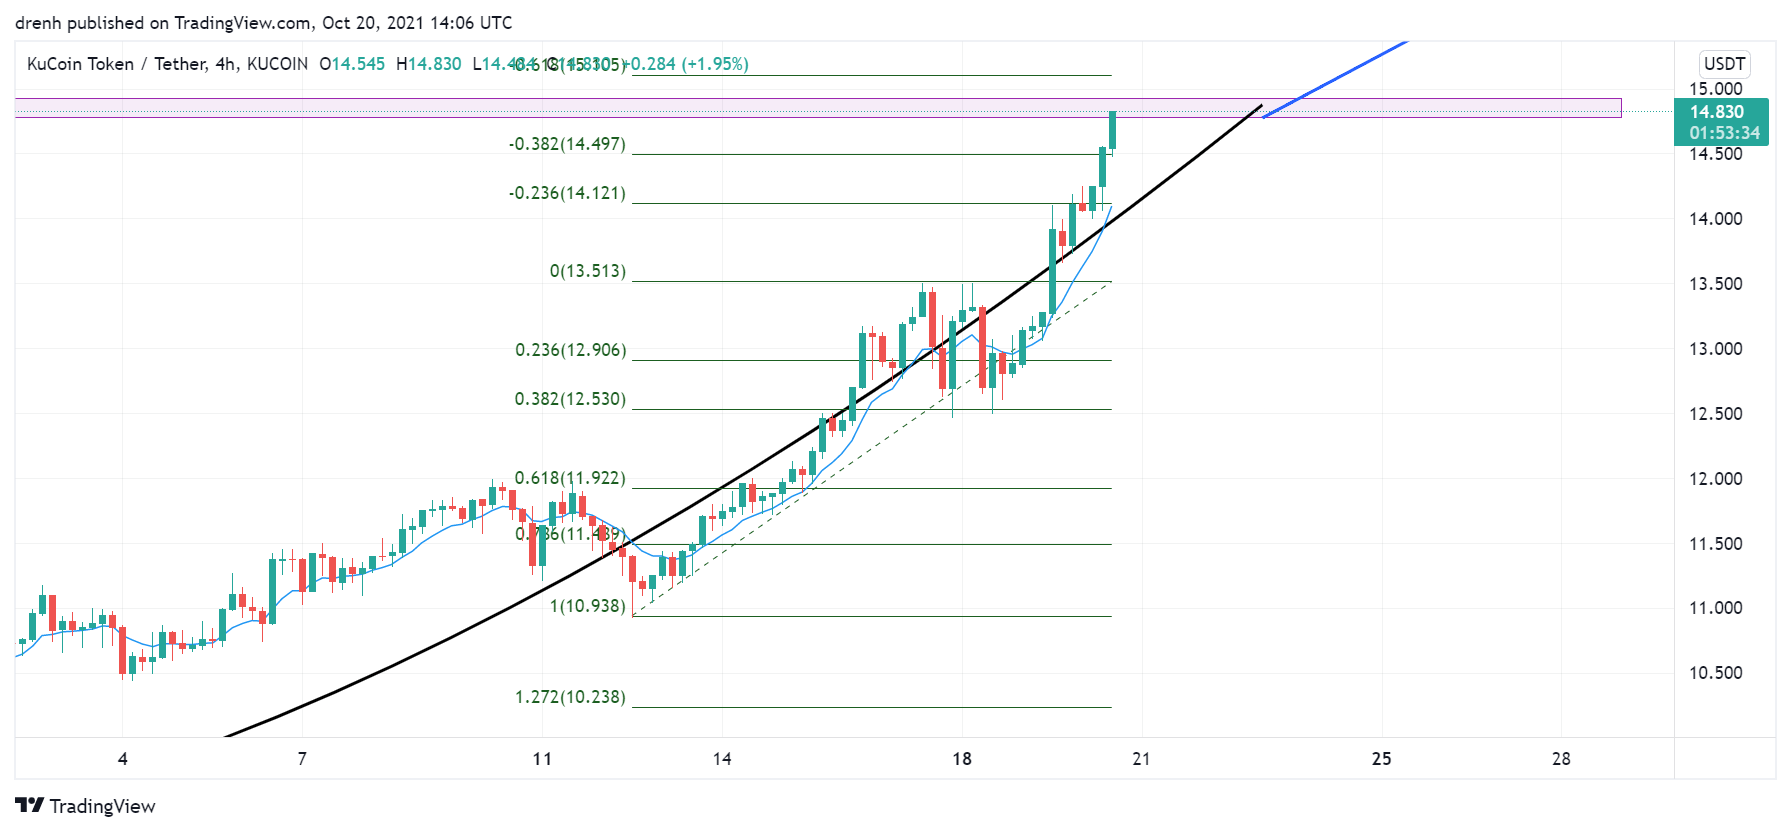
Fibonacci
The Fibonacci retracement levels suggest that the price of KCS has recently retraced to the 38.2% level. After that, the price started increasing and it has surpassed the 38.2% extension level.
Price Prediction KCS – October 2021
Based on this technical analysis on KuCoin (KCS), its price could keep increasing in the coming days, even though a pullback is imminent. The pullback is a result of KCS being in the overbought region. Nonetheless, the rounding bottom pattern suggests that the price could soon reach $20. Furthermore, if BTC keeps increasing at the same rate as it has recently, then KCS has the potential to go up to $50.
Latest News for KCS – Affecting Price
KuCoin (KCS) recently celebrated its anniversary. With its ever-growing community, the demand for KCS has increased massively. Consequently, the price of KCS has increased as well.
Also read: KuCoin (KCS) Price Prediction 2021 and Beyond – Will KCS Reach $100 in 2021?