


GALA Technical Analysis – December 2021
Monthly Analysis
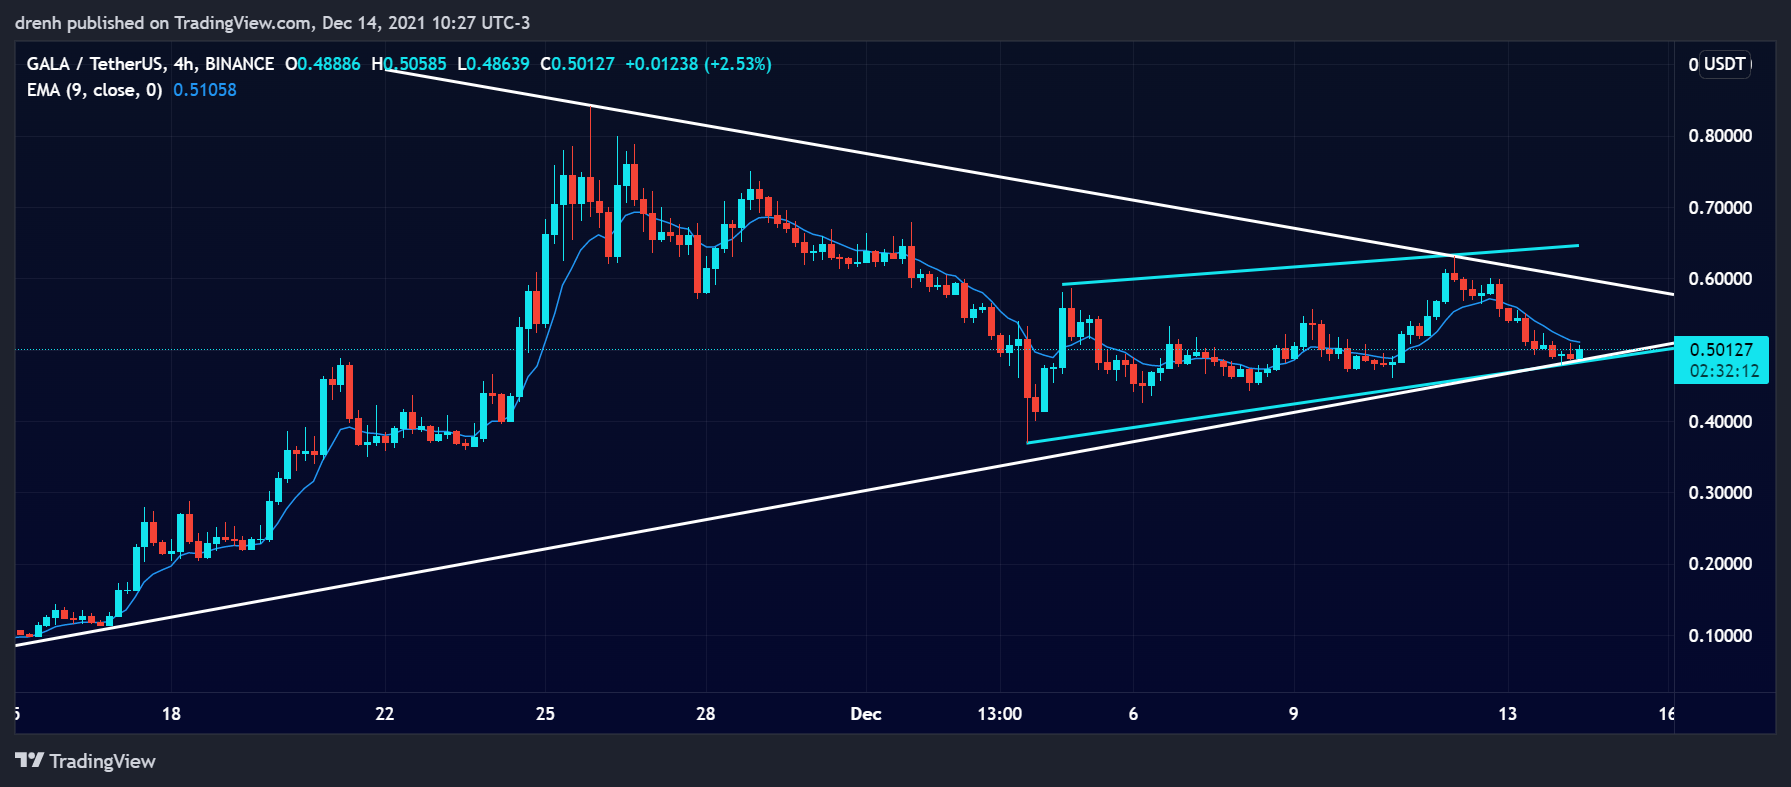
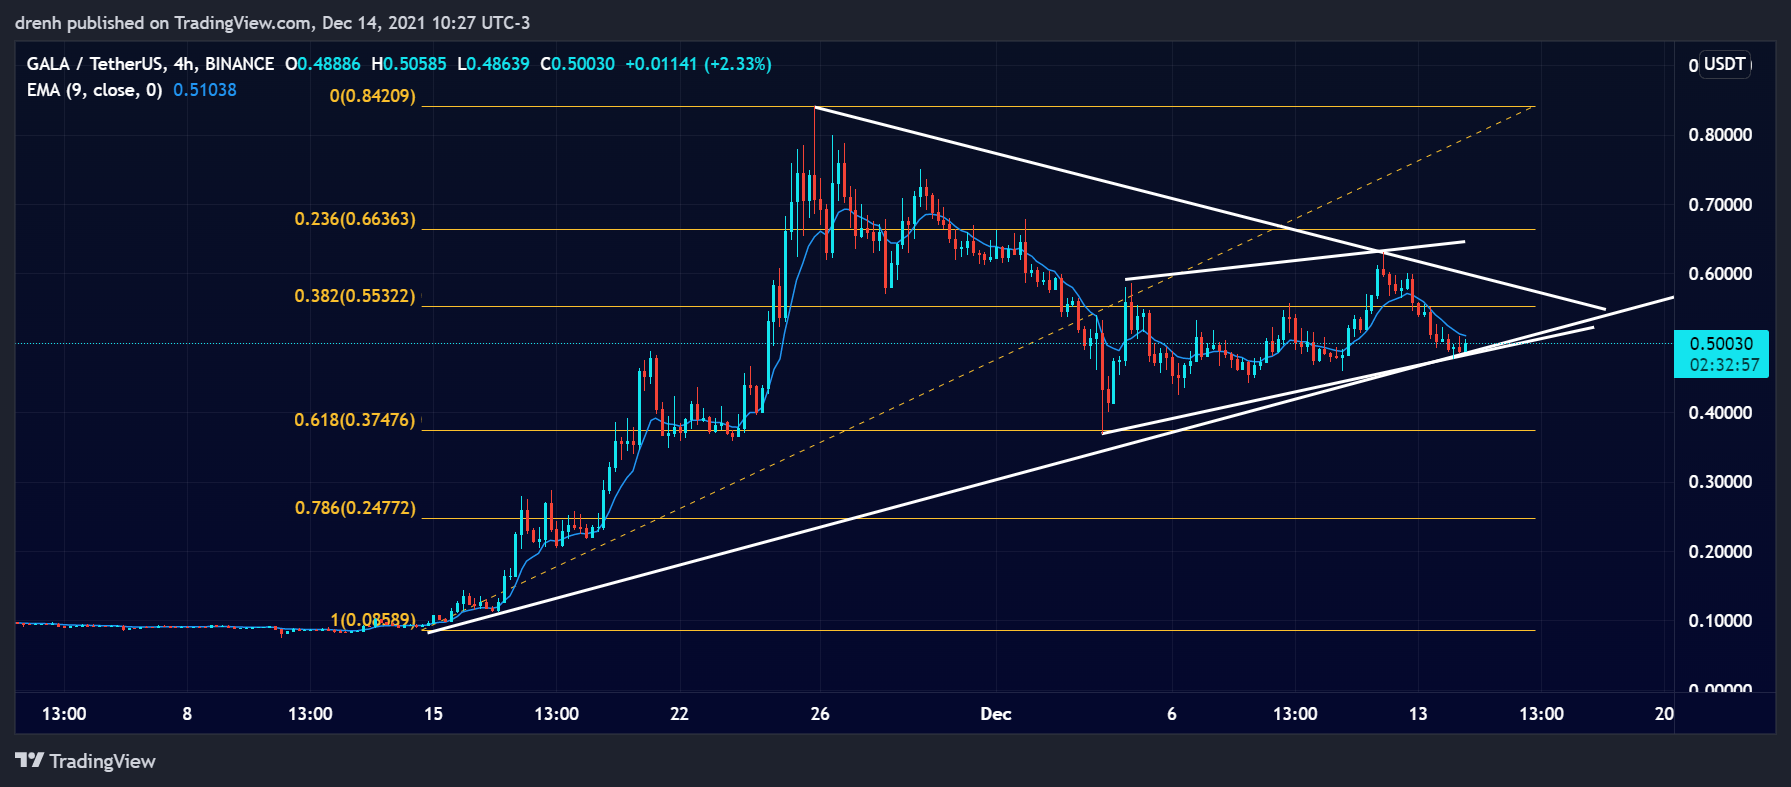
In the last 30 days, the price of GALA increased by more than 800%. The price reached an all-time high at $0.84. After that, the price has started declining. It dipped by 55%, but it found support at $0.37. The price is now in consolidation, as it is testing support at $0.47.

Weekly Analysis
In the last 7 days, the price has been increasing. GALA saw a rise of 40%, but it hit resistance at $0.63. The price has now retraced by 24%, and it is currently finding support at $0.47. The short-term trend is bullish for GALA, as the price could have another impulse wave in the coming days.
Daily Analysis
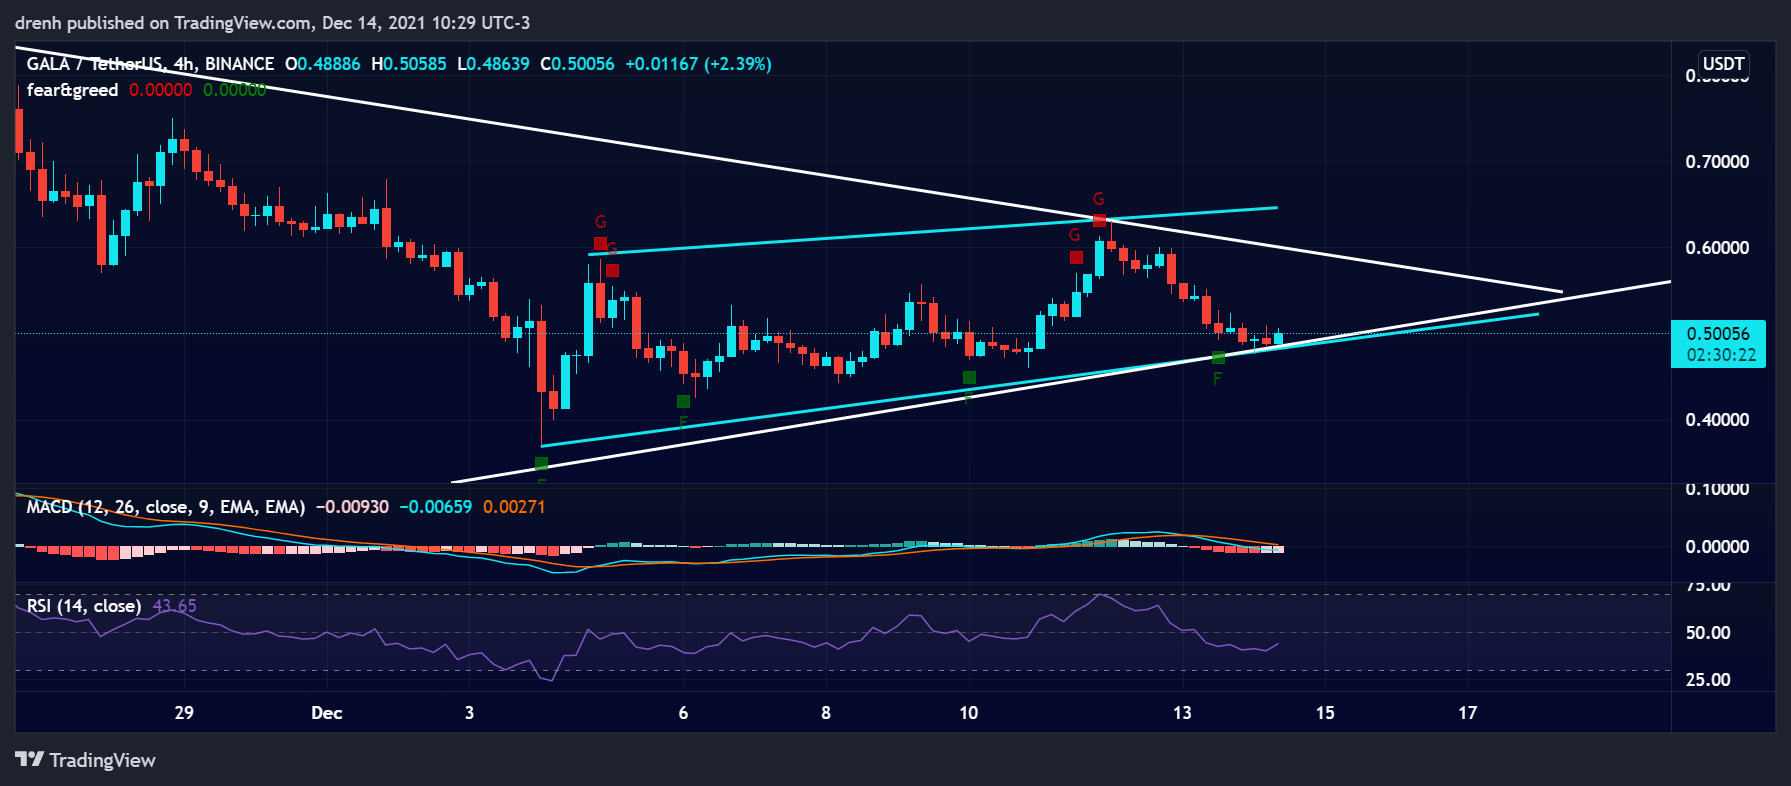
In the intraday chart, the price of GALA has increased by 7%, and it has been highly volatile. This has benefitted day traders. The price could head further down in the shorter run, as the intraday trend is bearish.
Key Structures
Support
- $0.46
Resistance
- $0.63
Indicators
Moving Average
The 20-moving average of a 4-hour chart is currently above the price of GALA, indicating that the trend is downward and that the price could keep declining in the coming days.
The 9-EMA of a 4-hour chart is also above the price, suggesting that GALA is bearish in the shorter run and that the EMA line could act as resistance to the price if the latter attempts to increase.
Relative Strength Index
The RSI of a 4-hour chart is well within the 30-70 range, but it is slightly below 50. This indicates that the price is slightly bearish, but it also shows that the price has room for growth.
MACD
The MACD line of a 4-hour chart is currently below the signal line and below the baseline, meaning that the momentum is bearish and that the price could keep declining in the coming days, other things equal.
Fear & Greed
The fear and greed indicator of a 4-hour chart suggests that the current emotion of GALA traders is fear, indicating that the price could keep declining.

Fibonacci
The Fibonacci retracement levels of a 4-hour chart suggest that the price of GALA had found support at the 61.8% Fibonacci level, finding strong support and that the price could surge upward in the coming days.
Price Prediction GALA – December 2021
Based on this technical analysis on Gala (GALA), the price could increase in the coming days, and it may retest resistance at $0.63. If this resistance is broken, then it could head upward and reach a new all-time high at around $1 in the coming weeks. However, if that resistance is strong, GALA could decline further down in the short run.
Latest News for GALA – Affecting Price
Gala has been gaining more attention recently due to the success of its metaverse-based games. If this trend continues, we could see the demand for GALA surge upward, increasing its price in the coming months.
Also read:
Gala Coin Price Prediction 2022 and Beyond – Will GALA Reach $1?
Cryptocurrency and Metaverse – What is the Connection Between Cryptocurrencies and Metaverse?
These are the Top 5 Metaverse Coins to Buy Right Now
Decentraland Price Prediction 2021 and Beyond – Is MANA a Good Investment?
Sandbox Price Prediction 2022 and Beyond – Will SAND Reach $100?
Axie Infinity (AXS) Price Prediction 2021 and Beyond – Will AXS Hit $200 in 2021?