

FKX Technical Analysis – October 2021
Monthly Analysis
Over the last 30 days, FKX has decreased by 35%, but it had a bullish breakout of 80% before declining again. Recently, the price has increased by 67%, indicating that FKX is bullish once again.
Weekly Analysis
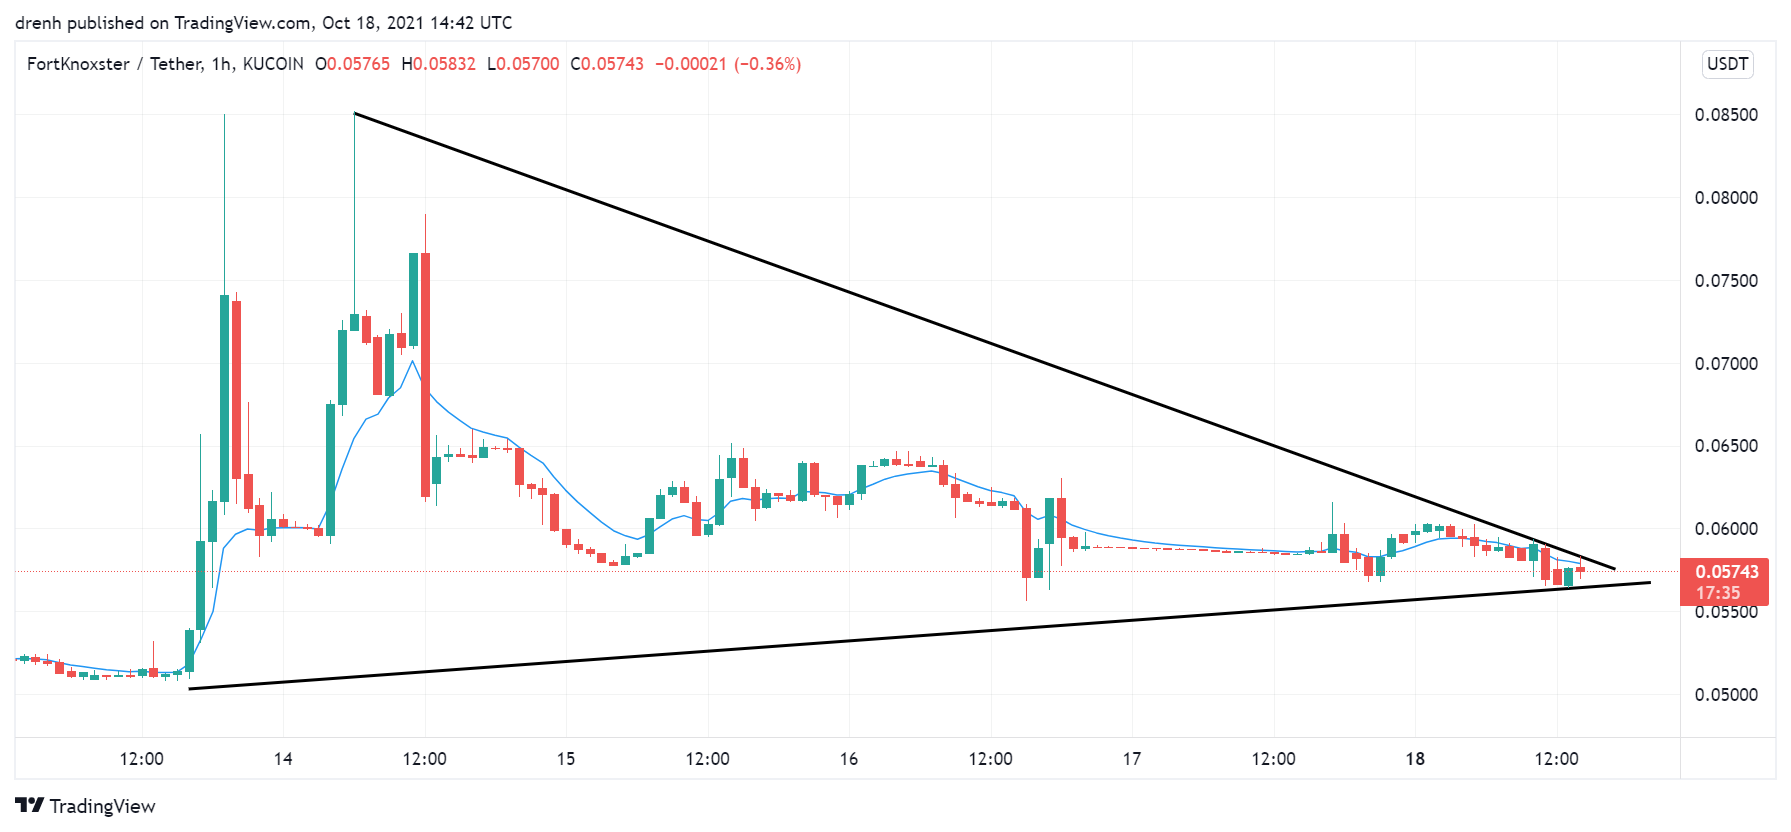
Over the last 7 days, the price of FKX declined by 35%. Recently, the price had been relatively stable, even though there were bullish breakouts. A triangle pattern has taken shape, indicating that a breakout might occur soon.

Daily Analysis
In the intraday chart, the price of FKX has been bearish. It has decreased by 6% in recent hours. This could see the price of FKX decline in the coming hours.
Key Structures
Support
- $0.04
Resistance
- $0.09
Indicators
Moving Average
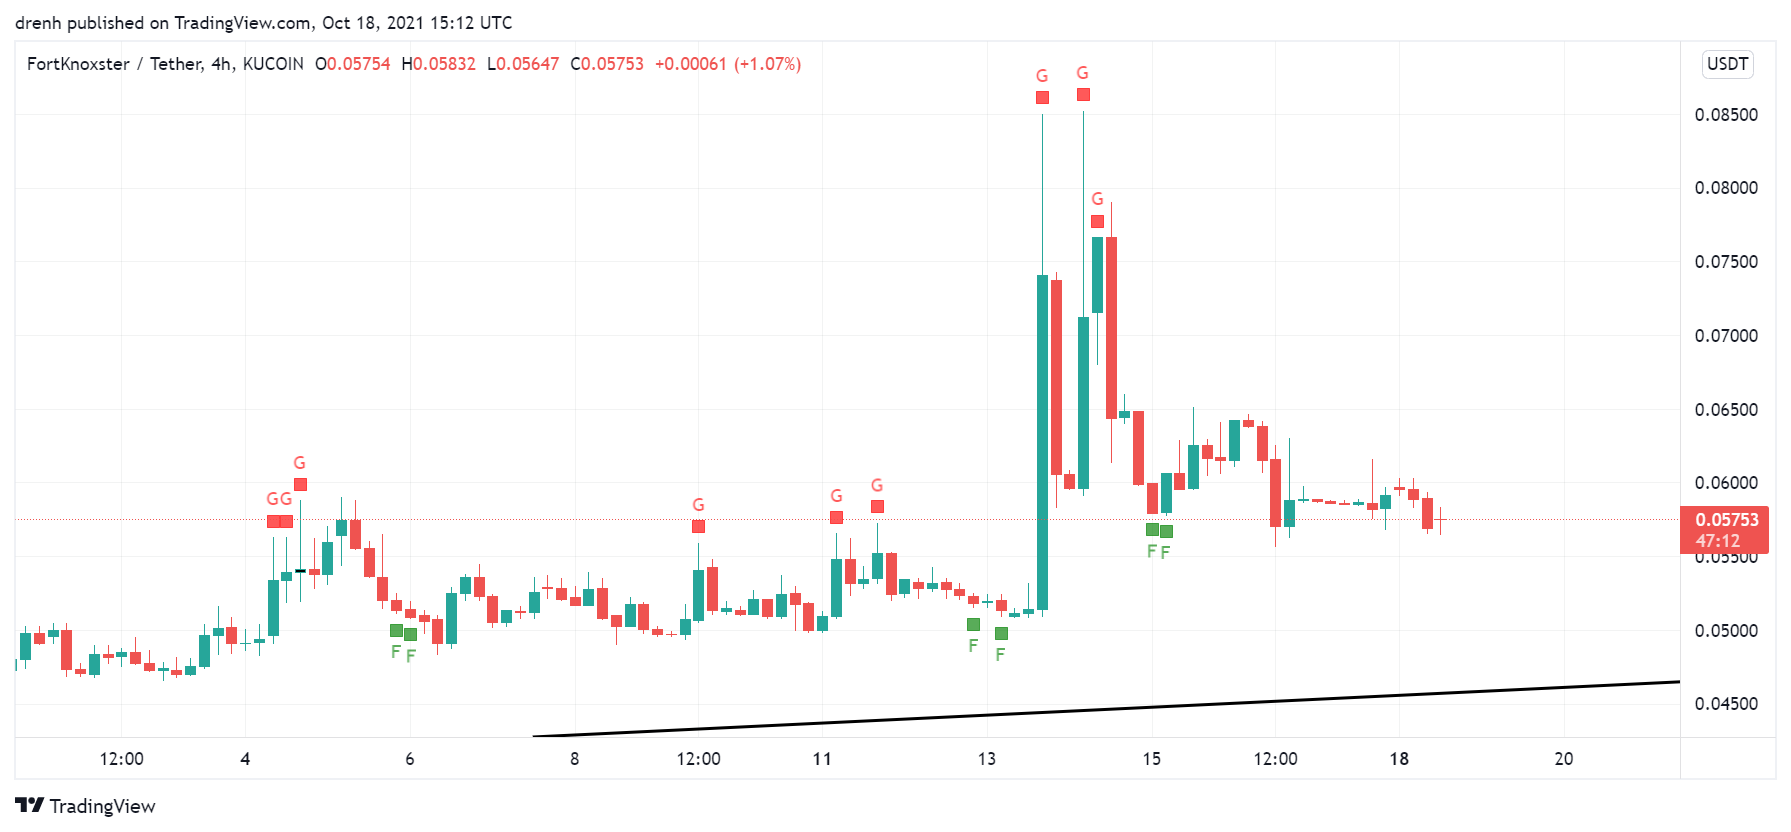
The 20-day moving average is below the price, indicating that the trend is upward and that that the price of FKX could keep increasing in the coming days.
The 9-day EMA is currently acting as support, meaning that if the daily candlestick closes above the EMA line, then the price could keep increasing in the short run.
Relative Strength Index
The RSI is above 50, meaning that the buying pressure is higher. It has slightly declined recently after approaching the overbought region. In a 4-hour chart, the RSI is slightly bearish as it was recently below 50. It indicates that there is plenty of room for growth in the price of FKX.
MACD
The MACD line is above the signal line and above the baseline in a daily chart. While the lines are converging, it indicates that the momentum is bullish and that the price could keep increasing in the coming days. As for the 4-hour chart, the MACD line is below the signal line and below the signal line, meaning that the momentum is bearish in the shorter run.
Fear & Greed
The fear and greed indicator suggests that the current emotion of FKX traders is fear due to the recent retracement of the price.
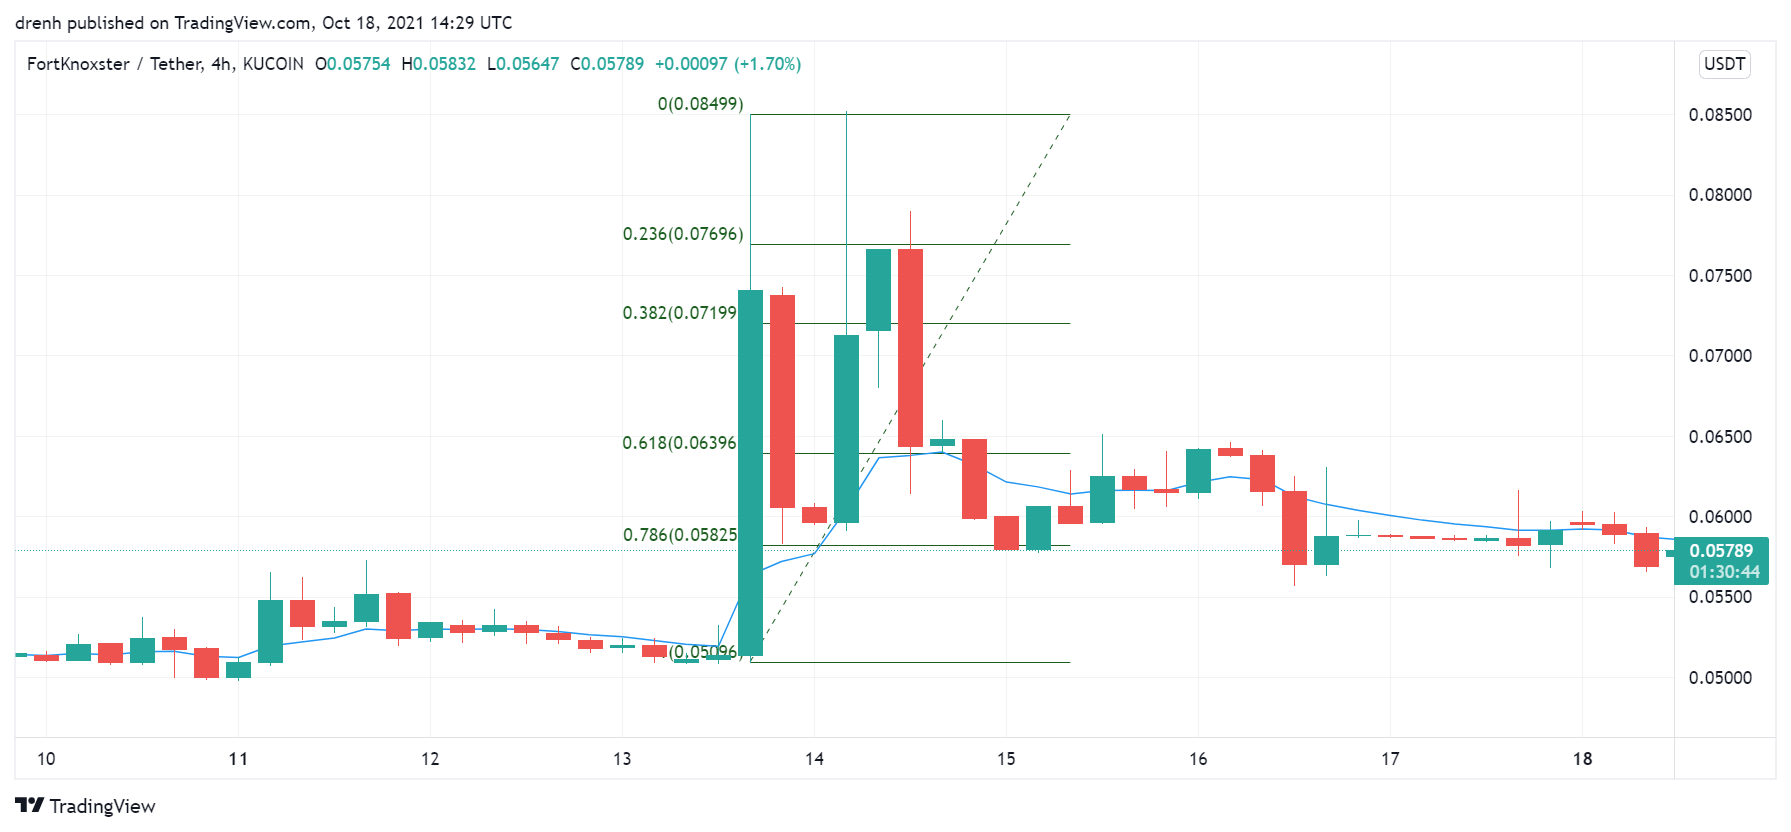
Fibonacci
The Fibonacci retracement levels suggest that the price had recently found support at the 78.6% level, and it then increased up to 0%. After that, the price declined and has been in consolidation.
Price Prediction FKX – October 2021
Based on this technical analysis on FortKnoxster (FKX), its price could increase and retest resistance in the coming days. If resistance is broken, then FKX could aim for a new all-time high. If BTC keeps increasing at the same rate, then FKX could eventually increase up to $0.50 in the coming weeks.
Latest News for FKX – Affecting Price
FortKnoxster has been developing its blockchain messenger. Experts suggest that it may even beat Telegram when it comes due to its private and encrypted features.
Also read: FortKnoxster Price Prediction 2021 and Beyond – Is FKX a Good Investment?