

FKX Technical Analysis – November 2021
Monthly Analysis
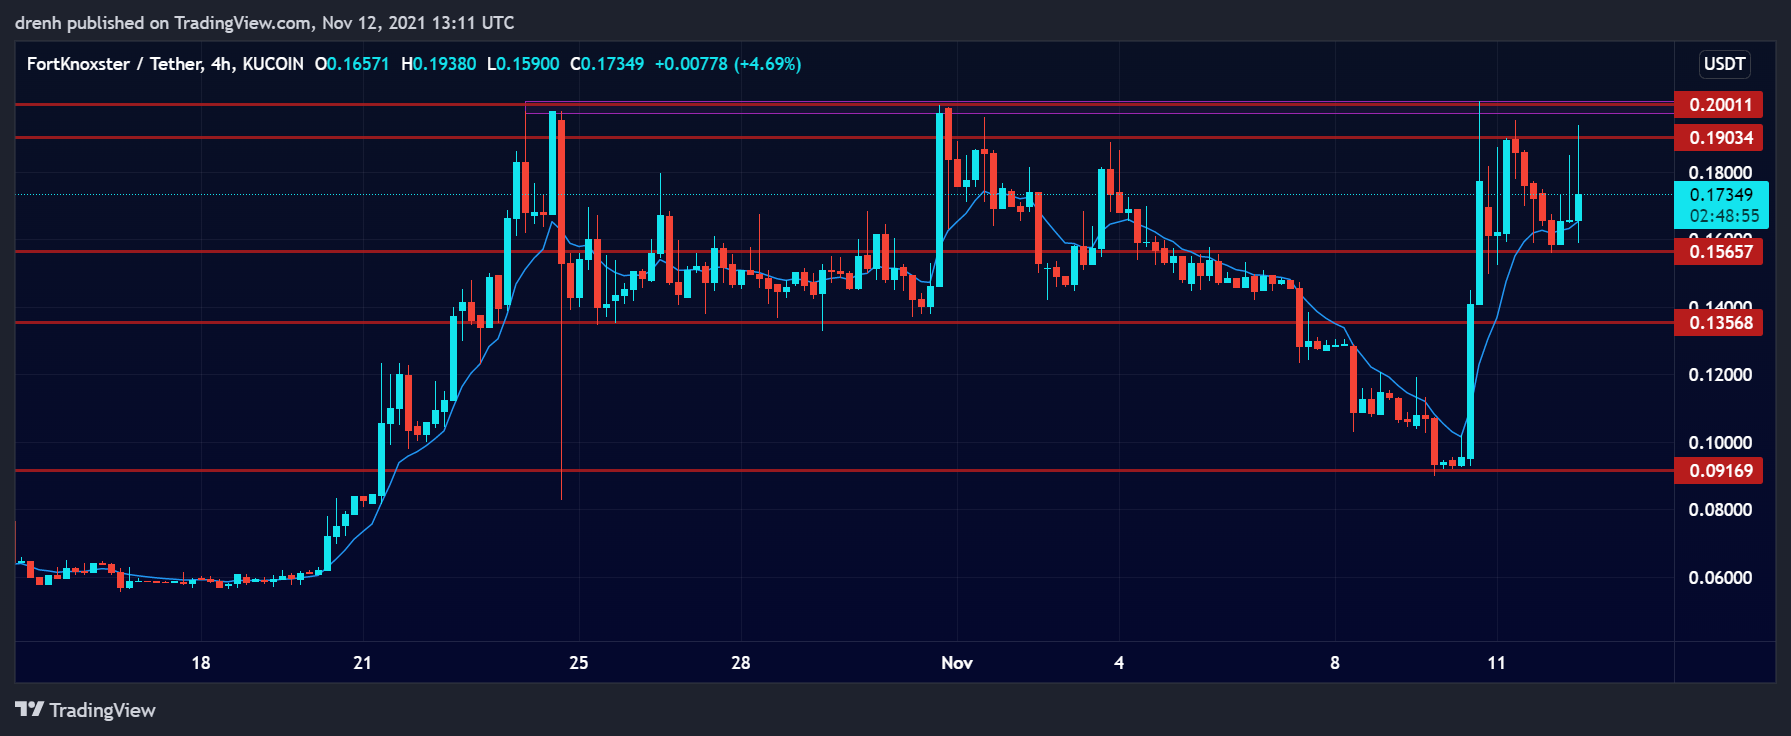
The last 30 days have been quite successful for FortKnoxster in terms of price. Active traders, as well as hodlers, benefited from price fluctuations, as the price of FKX increased by around 300%. It declined by as much as 58%, but it has increased up to $0.20 on three occasions. While traders could have generated huge profits, failing to beat resistance at $0.20 several times could indicate that the selling pressure at that region is so high for FKX to increase even more.

Weekly Analysis
Initially, FKX was bearish in the last 7 days. The price had declined by 43% before it found strong support at $0.09. After that, the price had a bullish breakout of around 124%. This has shown how volatile FKX can be, but it also shows that buyers have taken over once again. Nonetheless, the price has slightly retraced recently. This has created a triangle pattern on the 4-hour chart. This might lead to another bullish breakout for FKX.
Daily Analysis
In the intraday chart, FKX was recently bullish as the price increased by 18%. After a retracement, the price has had another bullish breakout of 21%, making FKX bullish in both the shorter run and the longer one.
Key Structures
Support
- $0.15
Resistance
- $0.20
Indicators
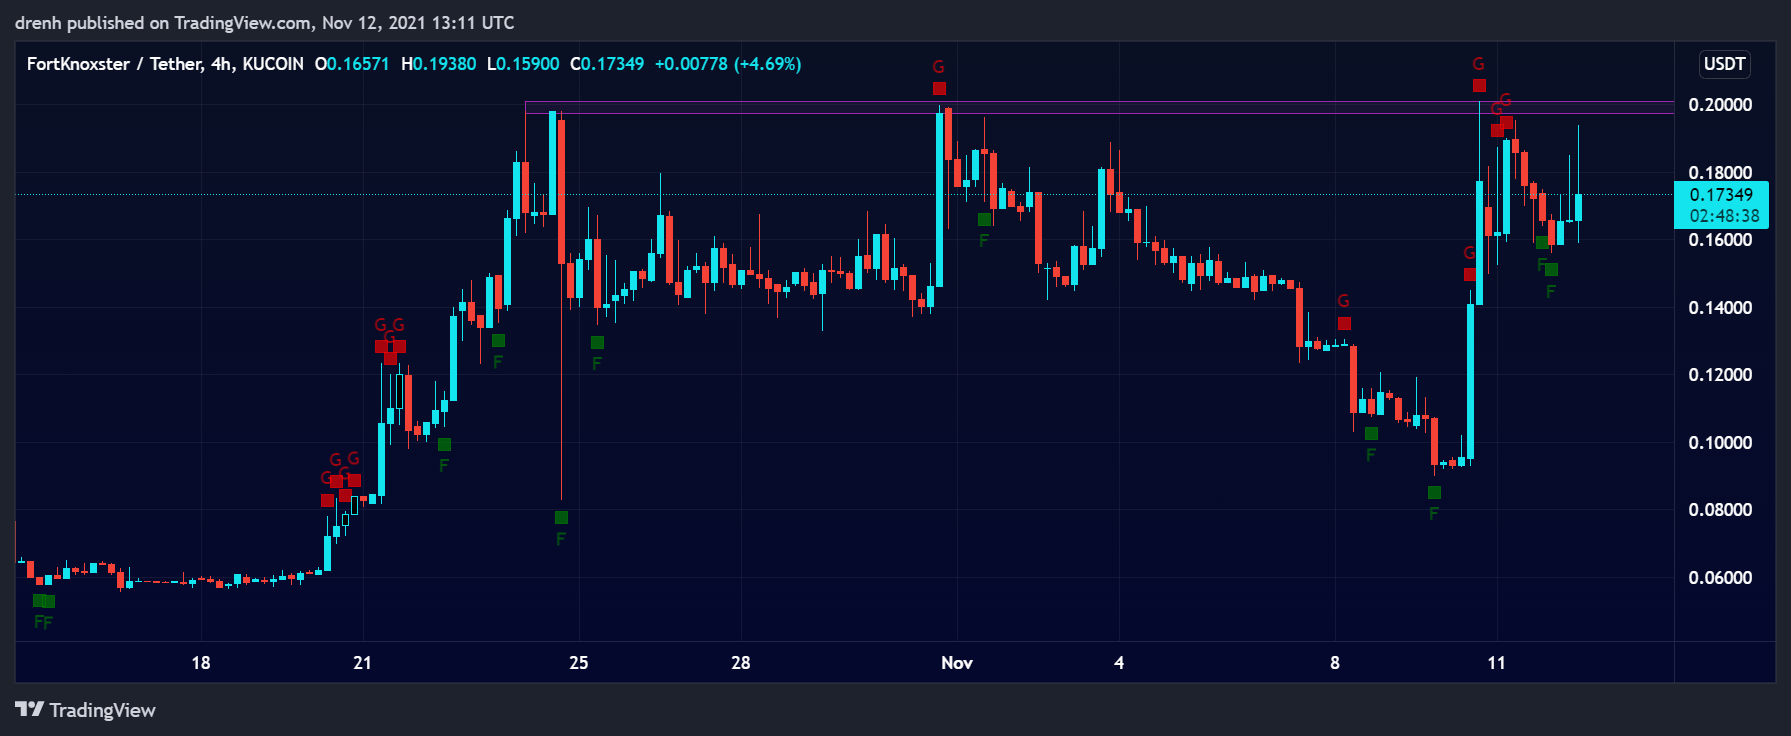
Moving Average
The 20-moving average of a 4-hour chart is quite below the price due to the recent upward surge, indicating that the trend is upward and that the price of FKX can keep increasing in the coming days.
The 9-EMA of a 4-hour chart is also below the price and is currently acting as a support structure for the price of FKX if the latter eventually tries to retrace again.
Relative Strength Index
The RSI of a 4-hour chart had recently been in the overbought region above 70, meaning that a retracement was imminent for FKX. Now that the price has found support again and is moving upward, the RSI is increasing and there is still a little more room to keep going before it hits 70 again.
MACD
In a 4-hour chart, the MACD line is above the signal line and above the baseline. This indicates that the momentum is bullish for FKX and that its price could keep increasing in the short run, other things equal.
Fear & Greed
The fear and greed indicator of a 4-hour chart suggests that the current emotion of FKX traders is fear due to the recent retracement. However, since the price is increasing again, we could expect traders to become greedy, especially if resistance at $0.20 is broken.
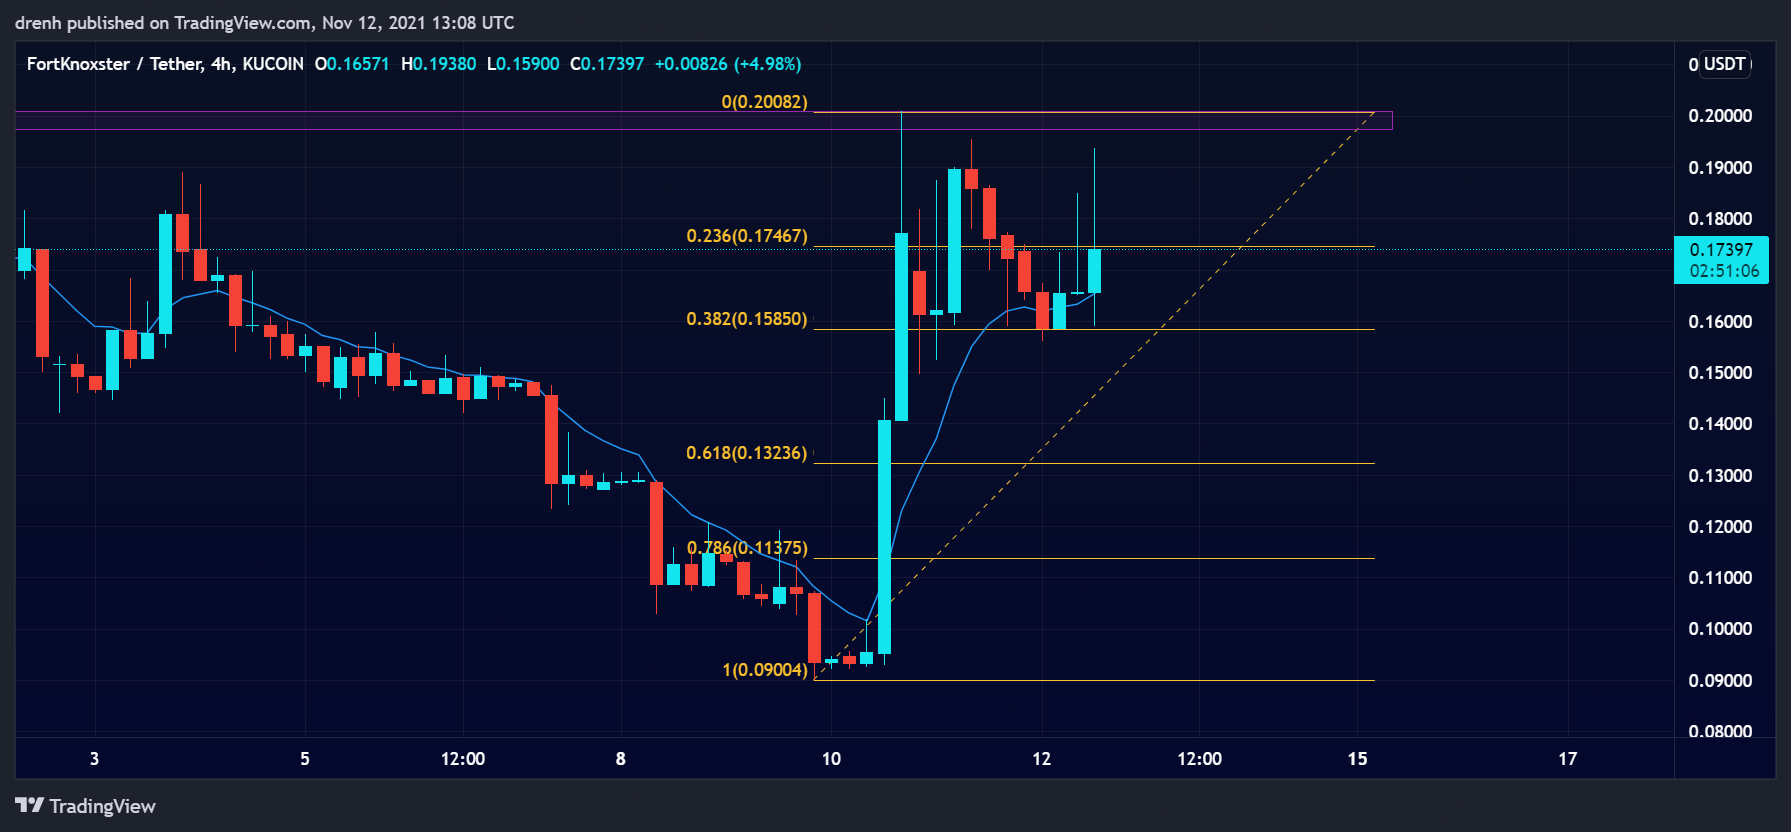
Fibonacci
The Fibonacci retracement levels of a 4-hour chart suggest that FKX has recently found support at the 38.2% level. The price has started increasing after that, and we could see the price move higher than the recent high of this trend.

Price Prediction FKX – November 2021
Based on this technical analysis on FortKnoxster (FKX), we could see its price keep increasing in the coming days. With a triangle pattern emerging and FKX finding support at the 38.2% level, we could see the price go at $0.24 and close to FortKnoxster’s all-time high. If BTC maintains its momentum and FKX follows, the latter can even aim as high as $0.50 in the coming weeks of this bull run. In the longer run, FKX has the potential to surpass $1 due to its utility and low market cap.
Latest News for FKX – Affecting Price
FortKnoxster has recently launched the Crypto Suite app. This app has multiple features, including an exchange, secure messages, video calling, etc. This might have been one of the reasons why FKX had the recent bullish breakout, and it may continue to increase in the coming weeks.
Also read: FortKnoxster Price Prediction 2021 and Beyond – Is FKX a Good Investment?