


FLOKI Technical Analysis – January 2022
Monthly Analysis
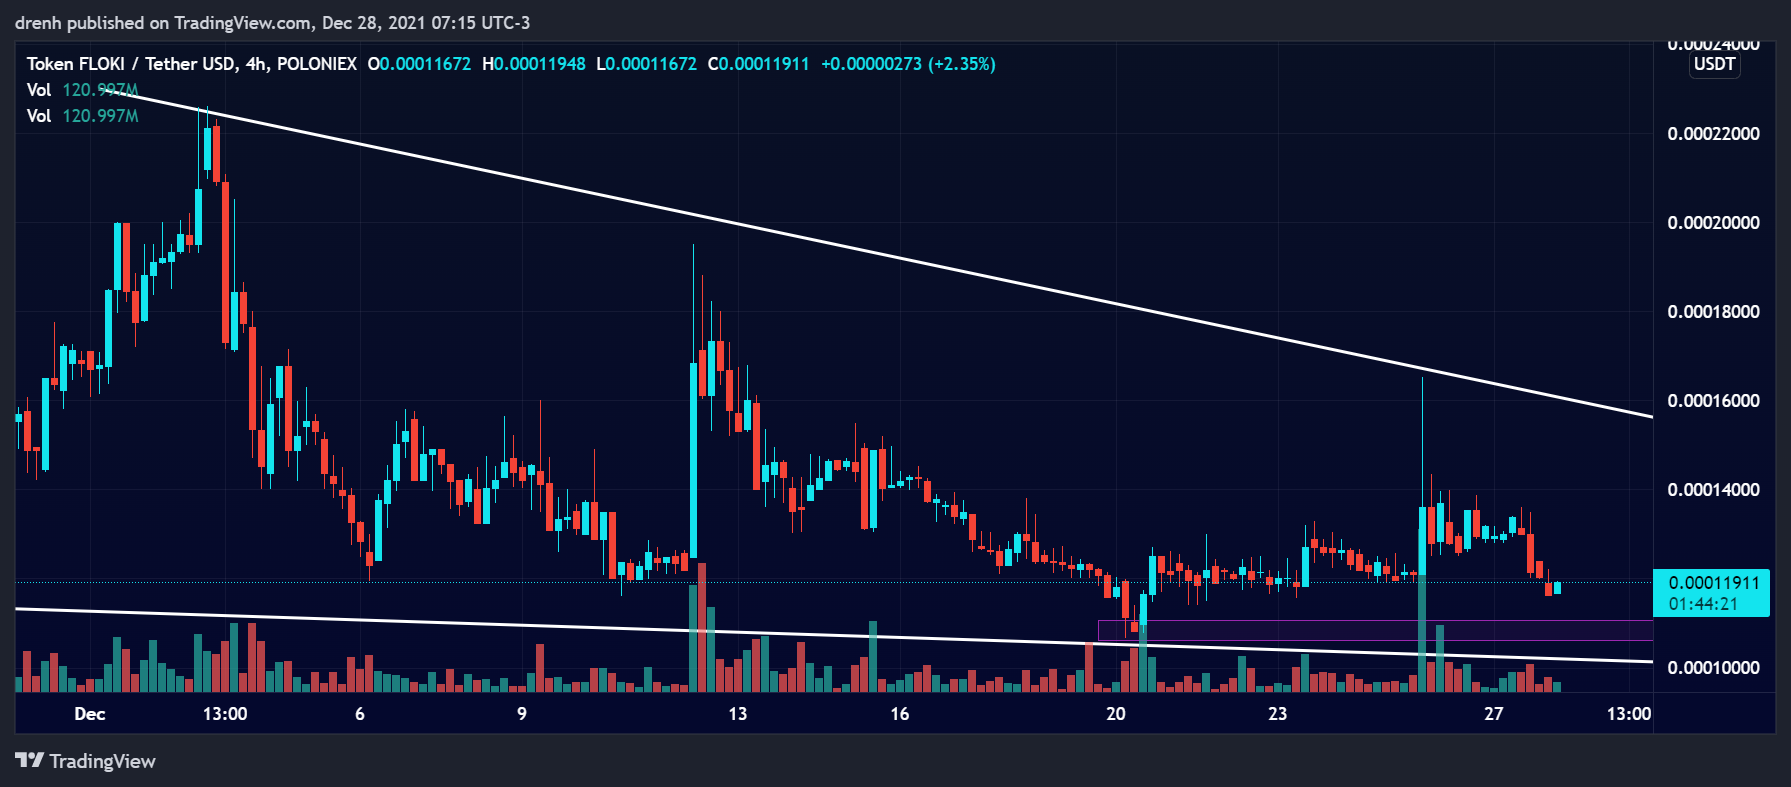
Throughout December of 2021, FLOKI was generally bearish. After initially increasing by more than 90%, the price dropped by around 50% in a matter of days. After another impulse upward of 70%, the price continued a bearish movement of more than 40%. Recently, the price has been attempting a correction. A descending wedge pattern was formed from the recent price movement in the 4-hour chart, indicating that a breakout could occur by the end of the wedge.

Weekly Analysis
In the last 7 days, the price of FLOKI was overall bullish as the price increased by more than 50%. After hitting resistance at $0.00016, the price retraced by around 30%. The price remains slightly bullish in the shorter term, but FLOKI is generally bearish as the descending wedge suggests.
Daily Analysis
In the intraday chart, FLOKI has been highly volatile and generally bearish. The price declined by around 15% in the last 24 hours, indicating that the price of FLOKI could keep declining in the coming hours.
Key Structures
Support
- $0.00010
Resistance
- $0.00016
Indicators
Moving Average
The 20-MA line of a 4-hour chart is currently above the price FLOKI, indicating that the current trend is downward and that the price of Floki Inu could keep declining in the coming days.
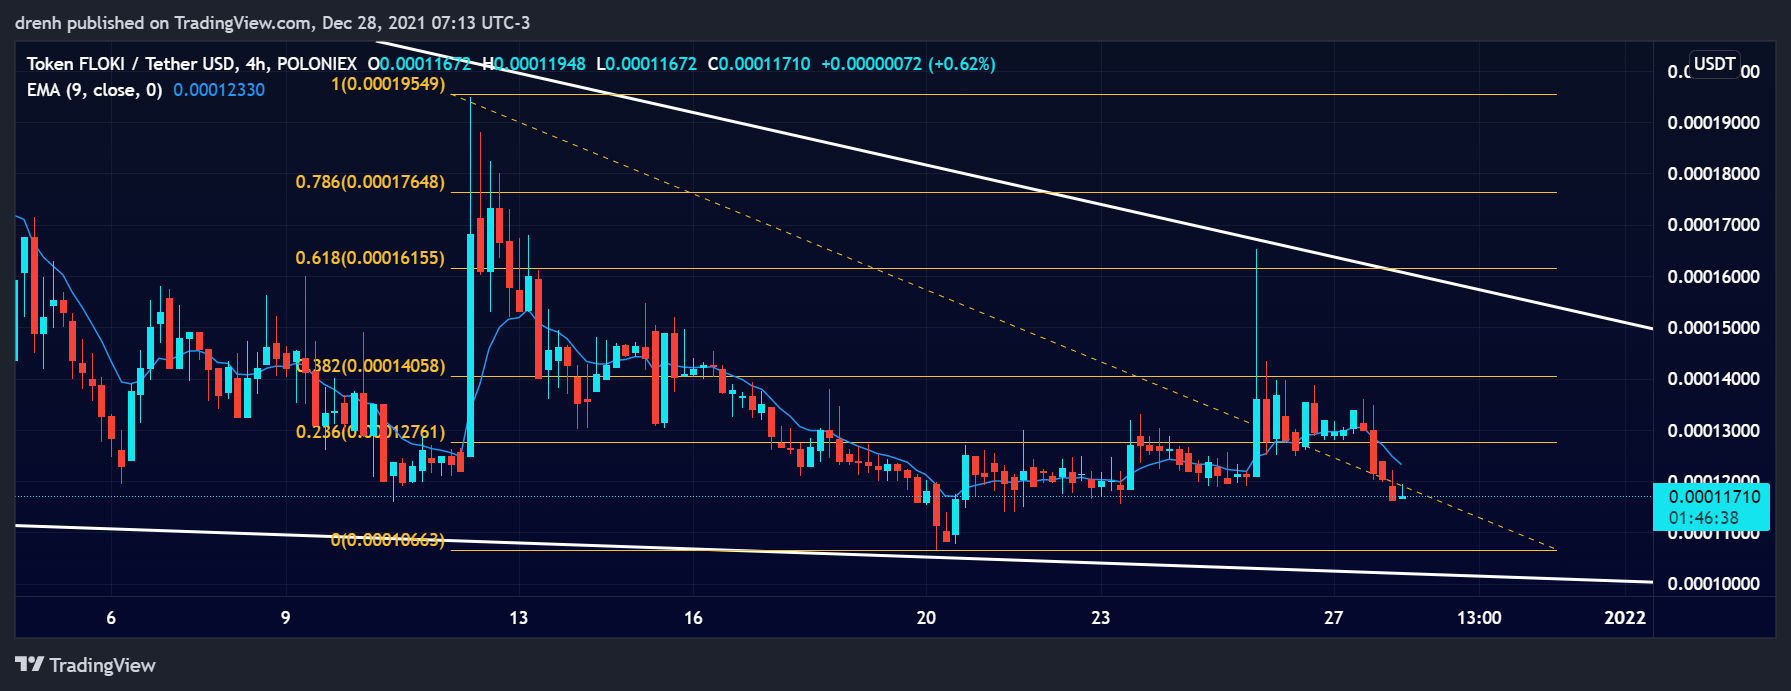
The 9-EMA of a 4-hour chart is also currently above the price, meaning that FLOKI is bearish in the short run and that the EMA line could act as resistance to the price if the latter attempts a correction.
Relative Strength Index
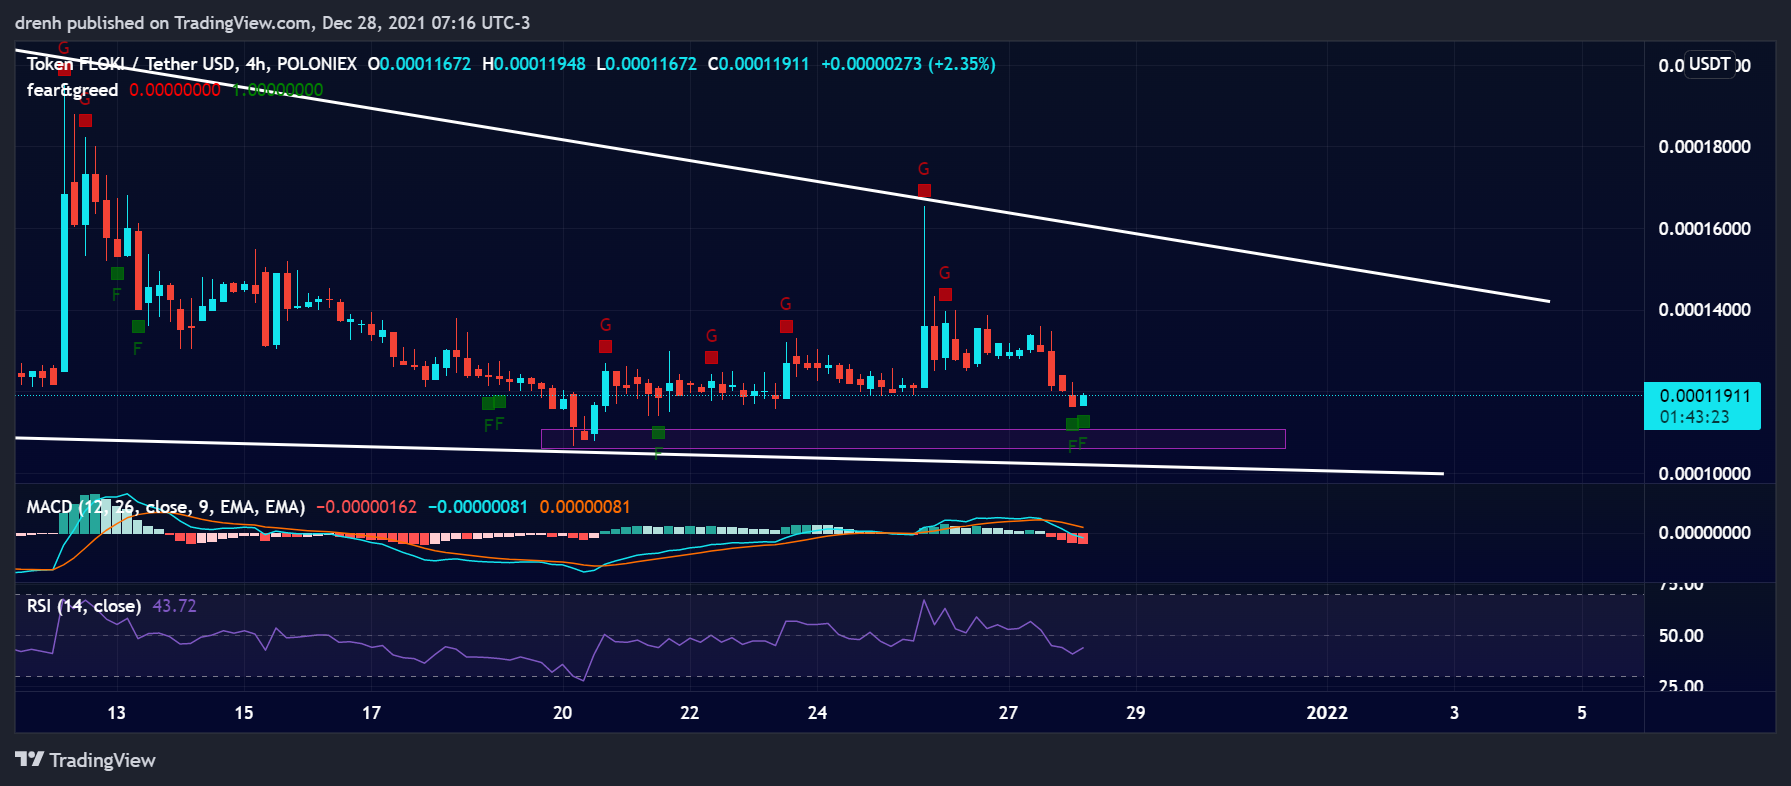
The RSI of a 4-hour chart is well within the 30-70 range, meaning that there is plenty of room for the price of FLOKI to either increase or decrease in the short run. The RSI is still below 50, but it has slightly increased due to recent candlesticks.
MACD
The MACD line of a 4-hour chart is currently below the signal line and below the baseline, indicating that the current momentum is bearish for FLOKI and that the price could potentially decline in the short run.
Fear & Greed
The fear and greed indicator of a 4-hour chart suggests that the current emotion of FLOKI traders is fear due to the recent decrease in the price. This could play a role in the price of FLOKI in the short term.

Fibonacci
The Fibonacci retracement levels of a 4-hour chart suggest that the price of FLOKI has retraced to the 61.8% level from the recent downtrend. Since the price has started declining, we could see FLOKI go further down in the coming days.

Price Prediction FLOKI – January 2022
Based on this technical analysis of Floki Inu (FLOKI), we could see its price keep declining in the coming days. If support at $0.0001 is broken, FLOKI could go as low as $0.00008, if not below that level. As the wedge gets narrower, we could see a bullish breakout for FLOKI eventually, which would see its price aim for $0.0002 once again, other things equal. Nevertheless, FLOKI remains bearish in the short run.
Latest News for FLOKI – Affecting Price
Floki Inu has recently given Christmasgiveaways to its community. This has greatly impacted the Floki Inu community and furthermore increased the demand for FLOKI tokens.
We are pleased to announce the winners of our 40K Christmas Giveaway! 40 winners will each receive $1,000 USDT! See comments for access to the list of winners. Please message this account if you are one of the winners. Congratulations!
— Floki Inu (@RealFlokiInu) December 28, 2021
Also read:
What is Floki Inu Coin – A Detailed Explanation
Floki Inu (FLOKI) Price Prediction 2022 and Beyond – Will Floki Eventually Reach $1?
Floki Inu vs. Shiba Inu – Differences and Similarities