


FLOKI Technical Analysis – December 2021
Monthly Analysis
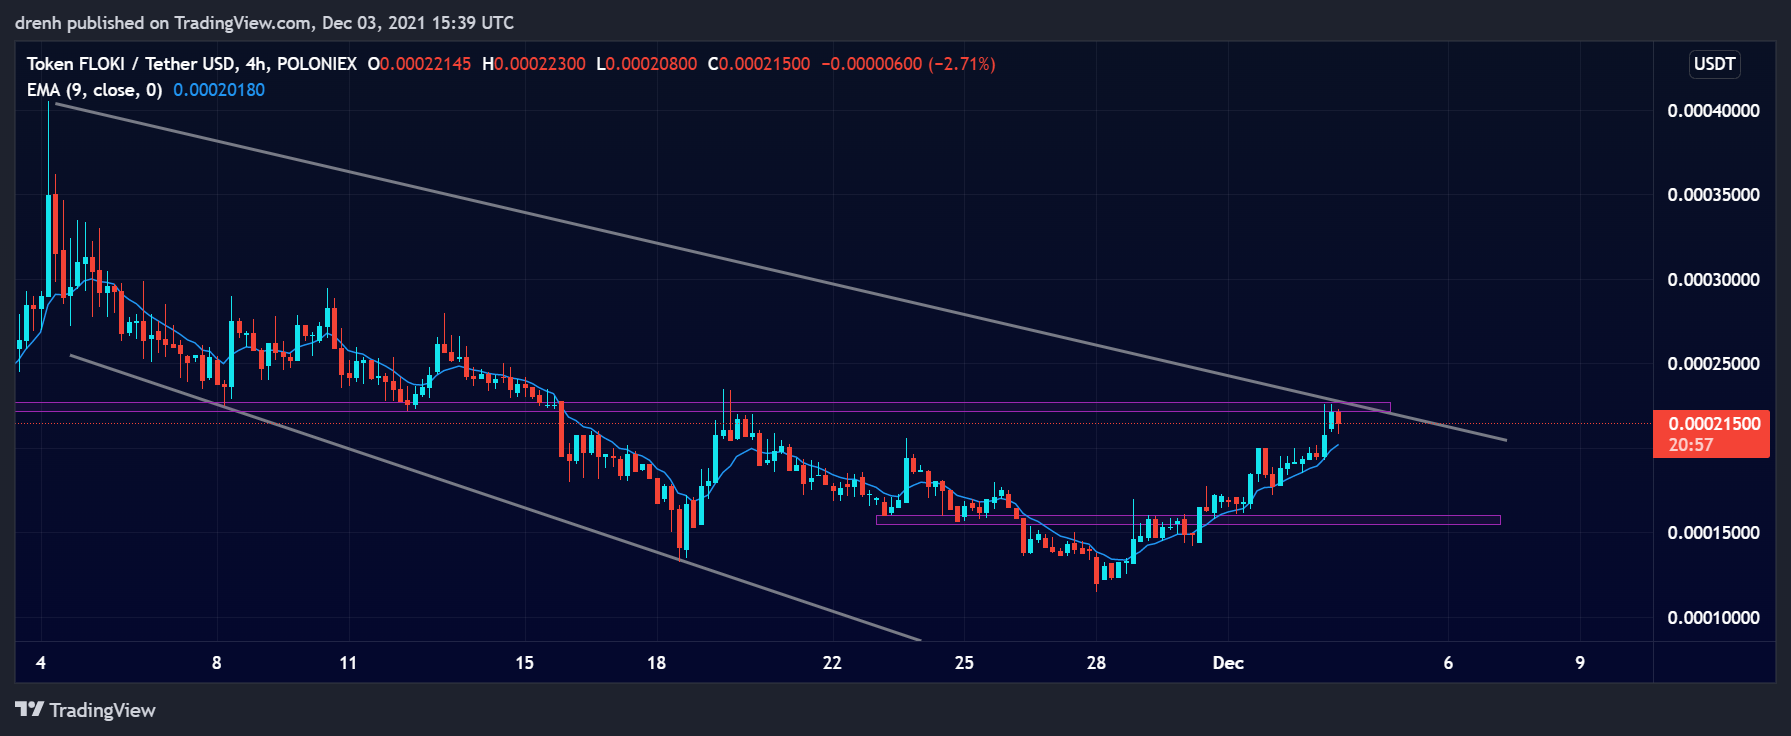
Over the last 30 days, FLOKI has been bearish. The price has declined by around 70%. It found strong support at $0.00011. After that, the price has been on the rise. So far, it has increased by around 97%, indicating that the trend is reversing. A retracement is imminent for FLOKI if the upward movement needs to continue.

Weekly Analysis
In the last 7 days, FLOKI has been bullish. The price has been on the rise ever since finding support at $0.00011. FLOKI is currently facing resistance at around $0.00023, and breaking this resistance could see FLOKI soar upward in the coming days.
Daily Analysis
FLOKI has been bullish in the intraday chart as well. In just the last 24 hours, the price has increased by 17%, suggesting that buyers have taken over for FLOKI and that the price could keep increasing in the short run.
Key Structures
Support
- $0.00011
Resistance
- $0.00023
Indicators
Moving Average
The 20-moving average of a 4-hour chart is below the price, indicating that the trend is now upward and that the price of FLOKI could keep increasing in the coming days.
The 9-EMA is also below the price, meaning that FLOKI is bullish in the short run and that the EMA line may act as support to the price if the latter attempts to retrace.
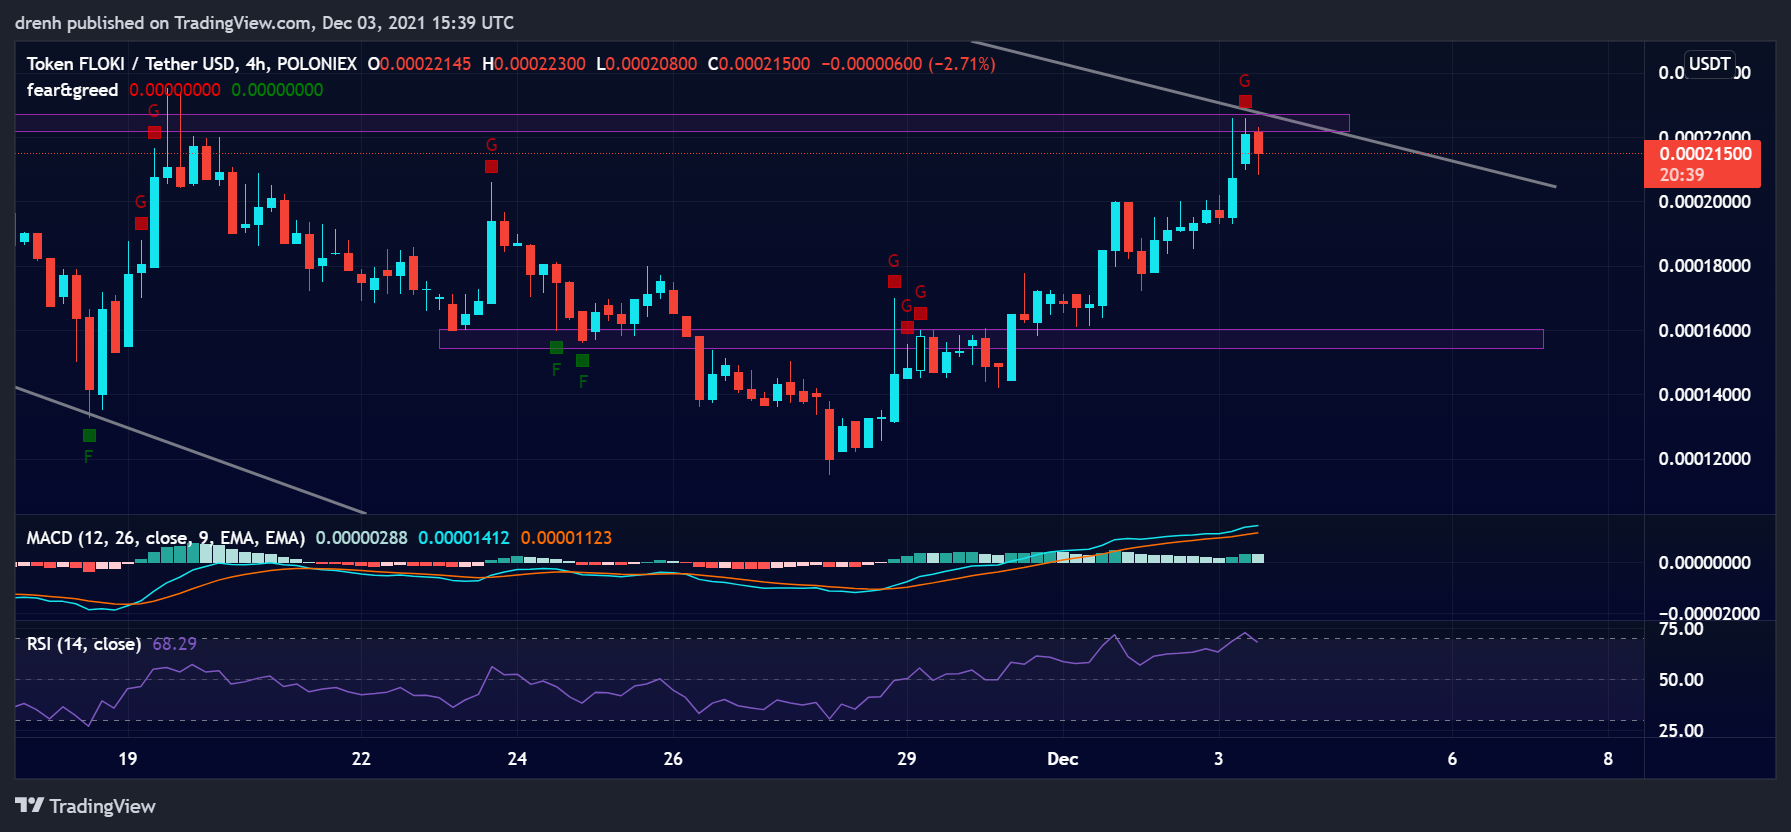
Relative Strength Index
The RSI of a 4-hour chart has slightly surpassed 70, meaning that FLOKI is now overbought. Therefore, we could see its price retrace in the near future until FLOKI has more room for growth.
MACD
The MACD line of a 4-hour chart is currently above the signal line, indicating that the momentum is bullish for FLOKI and that the price can keep increasing in the coming days.
Fear & Greed
The fear and greed indicator of a 4-hour chart suggests that the current emotion of FLOKI traders is greed due to the recent bullish surge in the price.

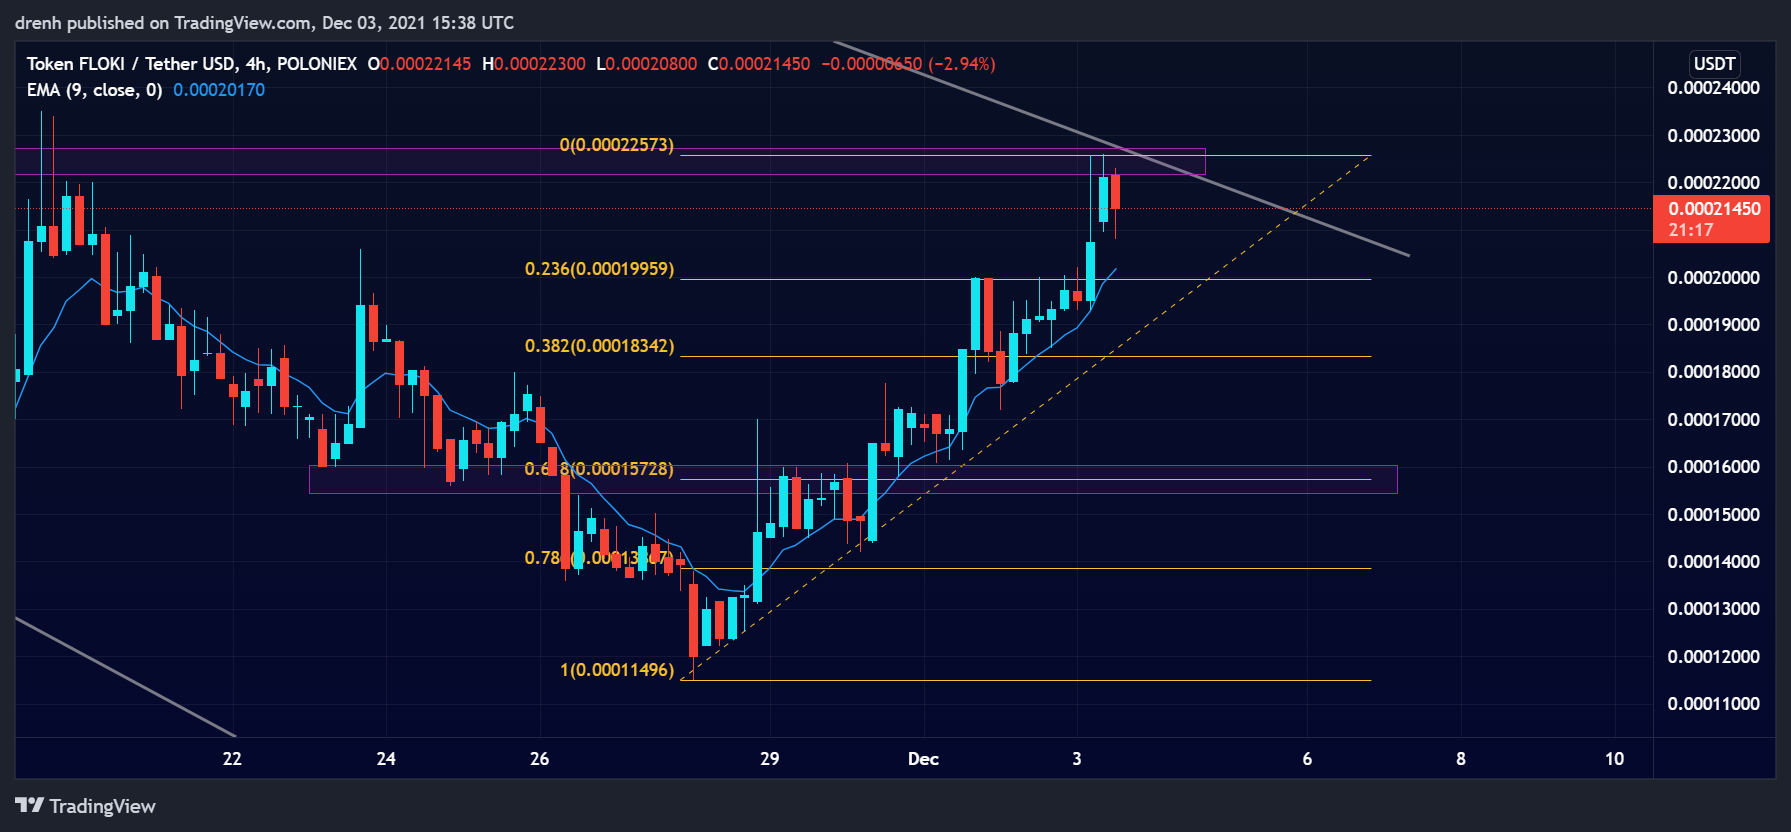
Fibonacci
The Fibonacci retracement levels suggest that if FLOKI retraces as expected, it could go as low as the 61.8% level. That level is at the same range as a previous support structure, indicating that this could be a strong zone of support.
Price Prediction FLOKI – December 2021
Based on this technical analysis on Floki Inu (FLOKI), we could see its price retrace to $0.00015 and find support there. After that, the price could move upward and break resistance at $0.00023. The price of FLOKI could then aim for $0.0003 in the following days. A new all-time high is reachable by the end of this cycle if the hype for meme coins remains high and BTC has another go upward.
Latest News for FLOKI – Affecting Price
Floki Inu may soon promote its token on the world’s tallest building in Dubai, the Burj Khalifa. This would largely increase the exposure of Floki Inu and could boost its price upwards once again.
Also read:
Floki Inu (FLOKI) Price Prediction 2021 and Beyond – Will Floki Eventually Reach $1?
What is Floki Inu Coin – A Detailed Explanation
Floki Inu vs. Shiba Inu – Differences and Similarities
How to Add Floki Inu to the Trust Wallet?
How to Buy Floki Inu – A Step-by-Step Guide