


ETH Technical Analysis – October 2021
Monthly Analysis
Over the last 30 days, ETH has been quite bullish, as BTC has been increasing at large rates too. It has increased by around 65% so far, and it might keep increasing in the coming days as well. It temporarily retested its all-time high, and it may soon break that resistance.

Weekly Analysis
In just the last 7 days, ETH has increased by 28%. Being the second biggest cryptocurrency in the market, its growth cannot be as big as other smaller coins. Nonetheless, ETH is still increasing at a fast pace.
Daily Analysis
After retesting its all-time high, ETH has been decreasing in the intraday chart. It has dipped by 8% so far today, but it may soon find support and go upward again.
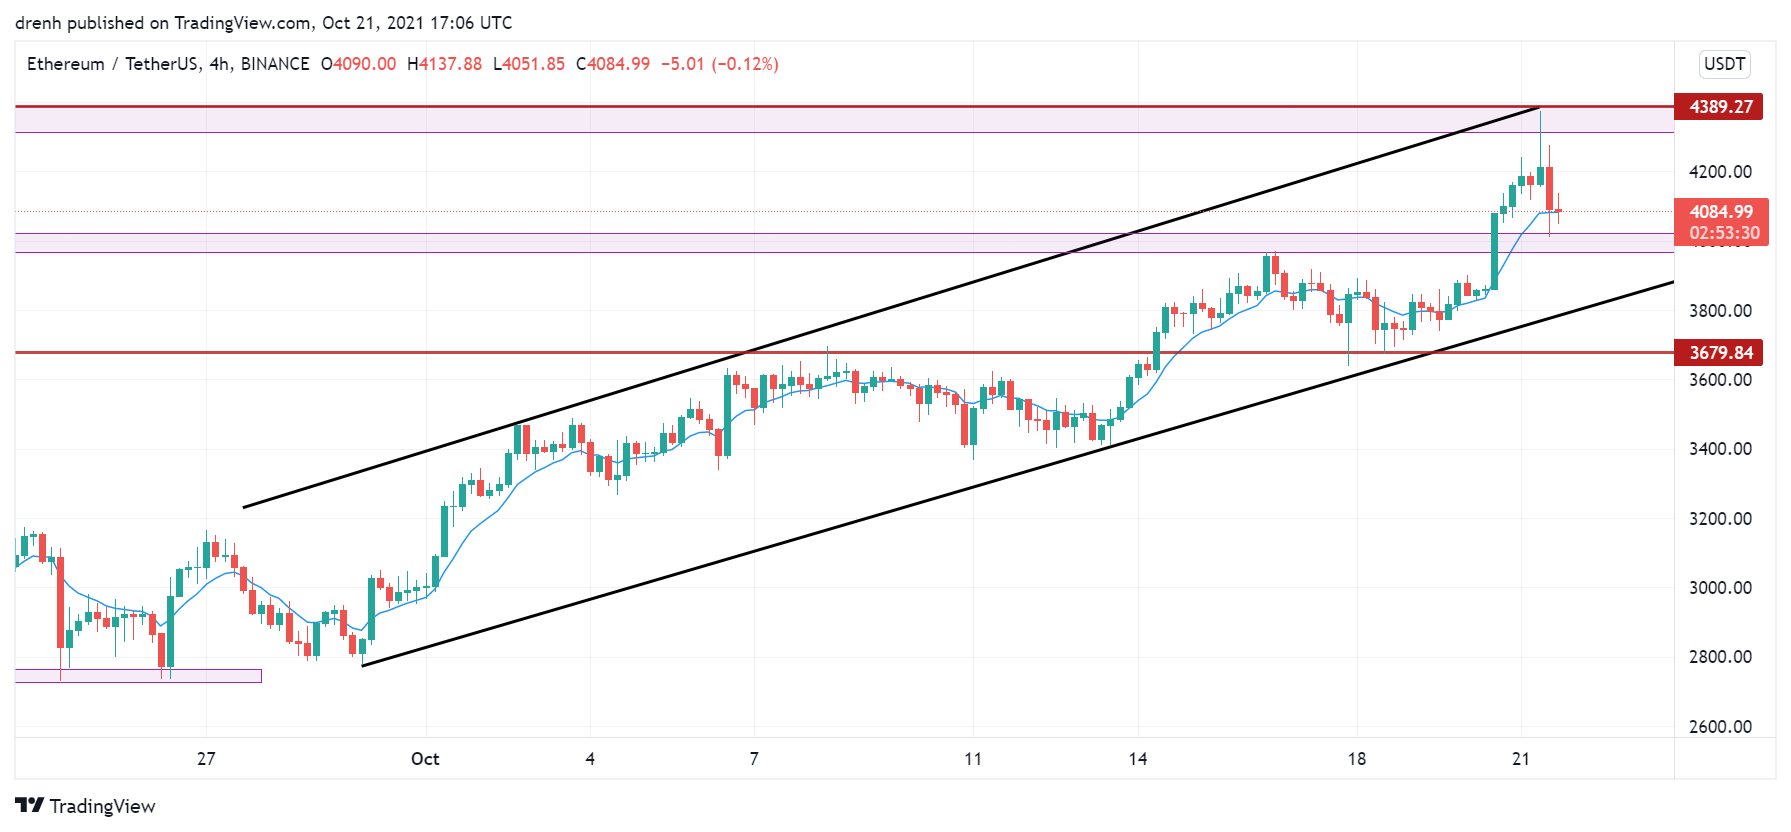
Key Structures
Support
- $3,960
Resistance
- $4,375
Indicators
Moving Average
The 20-day moving average is below the price, indicating that the trend is upward and that the price of ETH could keep increasing in the coming weeks.
The 9-day EMA is also below the price and may act as support for possible pullbacks in the coming days. It also indicates that ETH is bullish and that the price can keep increasing in the coming days.
Relative Strength Index
The RSI of a daily chart is very close to 70, meaning that ETH may soon be overbought. However, the recent pullback could give ETH the room needed for reaching a new all-time high very soon. In the 4-hour chart, the RSI was recently over 70, meaning that ETH was overbought. However, it has moved below 70 once again, indicating that the price could increase again.
MACD
The MACD line is above the signal line and above the baseline. This means that the momentum is bullish and that the price of ETH can keep growing. The same applies to a 4-hour chart.
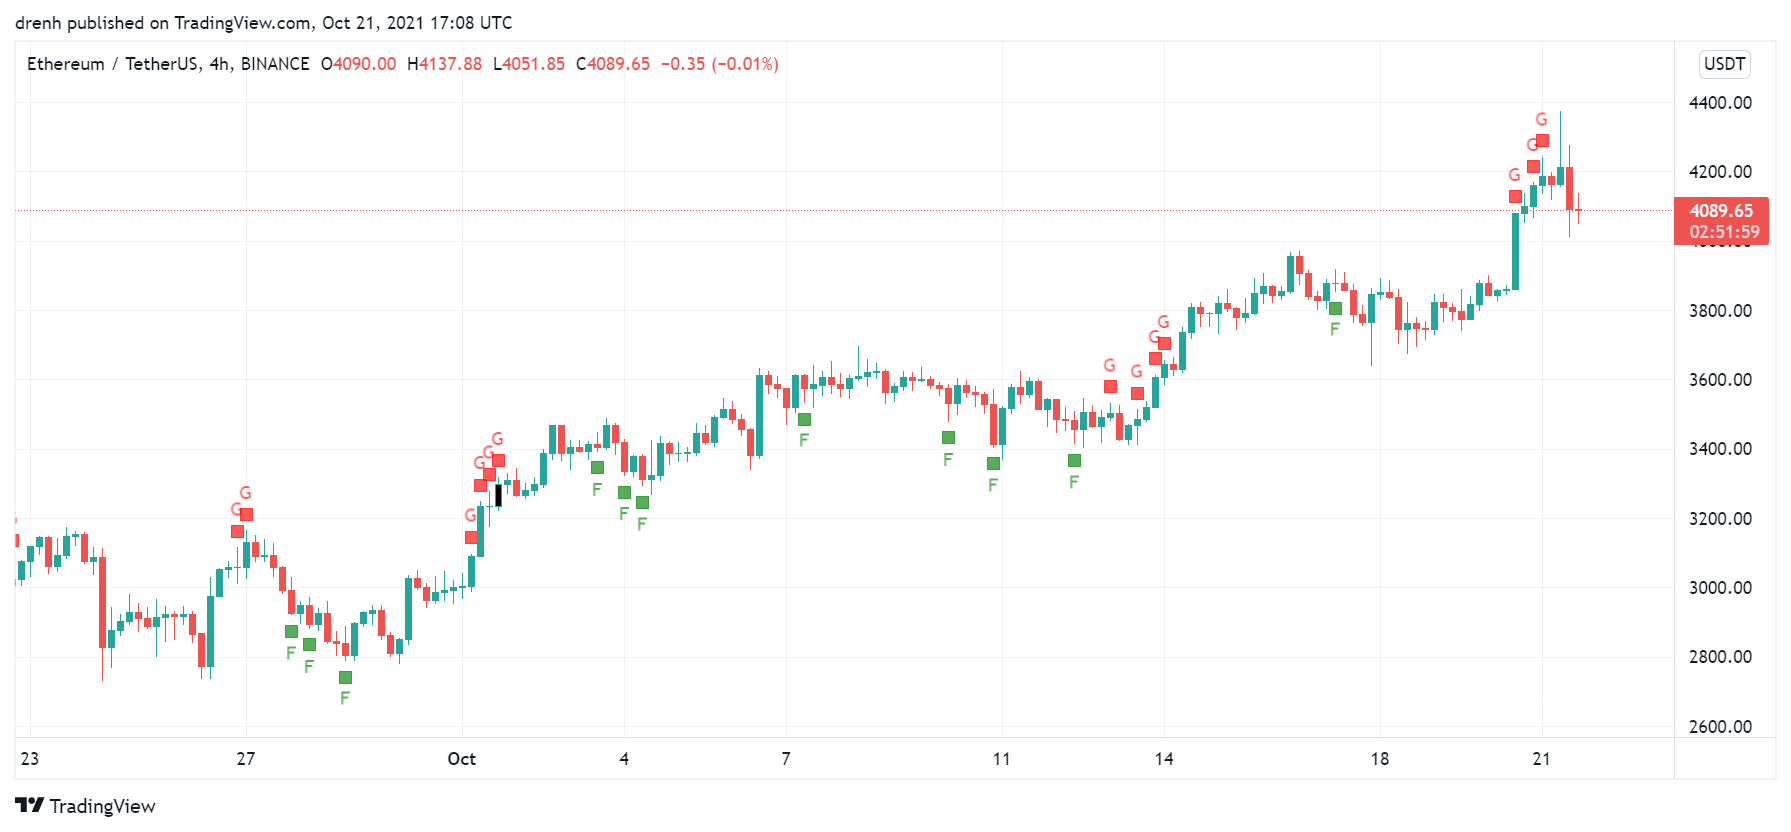
Fear & Greed
The fear and greed indicator in a 4-hour chart suggests that the current emotion of ETH traders is greed, meaning that investors are bullish.
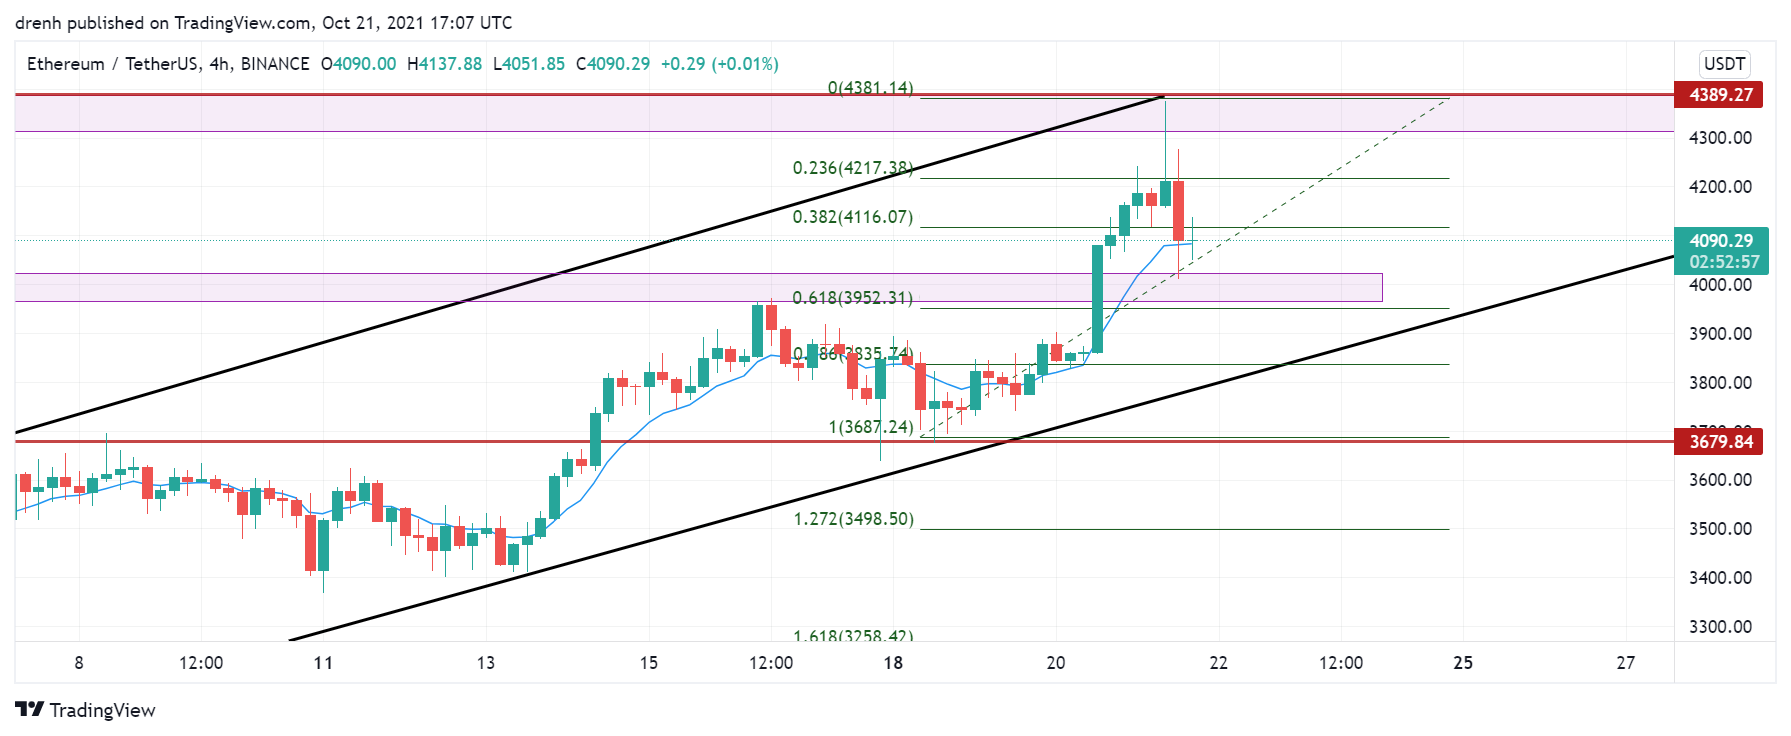
Fibonacci
The Fibonacci retracement levels suggest that ETH could find support at the 61.8% zone very soon. That structure also coincides with previous resistance structures, making this zone a strong support possibility.

Price Prediction ETH – October 2021
Based on this technical analysis on Ethereum (ETH), we could see its price reach a new all-time high very soon. If it finds support at the projected structure, then a price of $4,500 is quite possible in the next few days. Furthermore, if BTC keeps its pace and goes closer to $100,000, then ETH might hit $10,000 in the coming weeks.
Latest News for ETH – Affecting Price
Mark Cuban, a billionaire entrepreneur, has recently stated that Ethereum is the cryptocurrency with the most advantages in the market. Such statements coming from a whale investor can easily boost the price of ETH upward.
Also read: Ethereum Price Prediction 2021 and Beyond – Can ETH Reach $20,000 in 2021?