
Slightly Holds Past $3,000– August 10
The trade operation of ETH/USD slightly holds past the level at $3,000 while variant price fluctuations are taking place around it until the present. The crypto’s valuation trades around $3,144 at a percentage rate of about -0.61.
Slightly Holds Past $3,000: ETH Market
Key Levels:
Resistance levels: $3,300, $3,600, $3,900
Support levels: $2,700, $2,400, $2,100
ETH/USD – Daily Chart
The ETH/USD daily chart exhibits that the crypto’s price slightly holds past the $3,000 with a line of Japanese candlesticks’ convergence around it, promising a return of a downward force, possibly at a later session. The successive bullish candlesticks formerly featuring in a straight path to the moon are seemingly now facing a weakness around the point earlier mentioned. Hence, the reason for the price convergences. The 14-day SMA indicator is above the 50-day SMA indicator, briefly pointing to the north to indicate that an upward force is still on. The Stochastic Oscillators have slowly bent southbound out of the overbought region, pointing downward.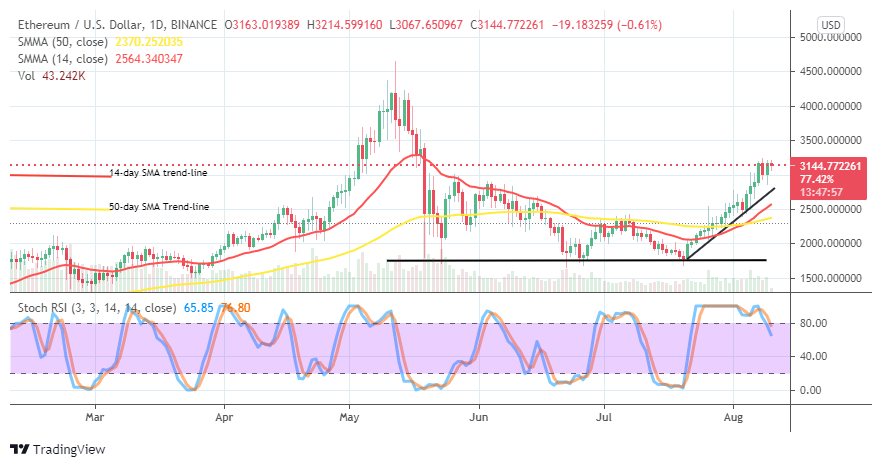
Hopefully, there may in the near time that price significantly reverses as the ETH/USD market slightly holds past $3,000. Above that value mentioned, the bulls’ capacity to push northward further appears not that reliable as there have been signs of rejections below the point of $3,300. At this trading time, the launching of further buying positions may have to be put on hold for a while to avoid the possibility of a bulls’ trap.
On the downside, it might take a while before the ETH/USD market bears possibly regain positions, especially if the price keeps attempting to push upward more between the points of $3,000 and $3,500. In those points, sideways price movements may feature if the two market movers fail to re-energize their stance in the crypto economy.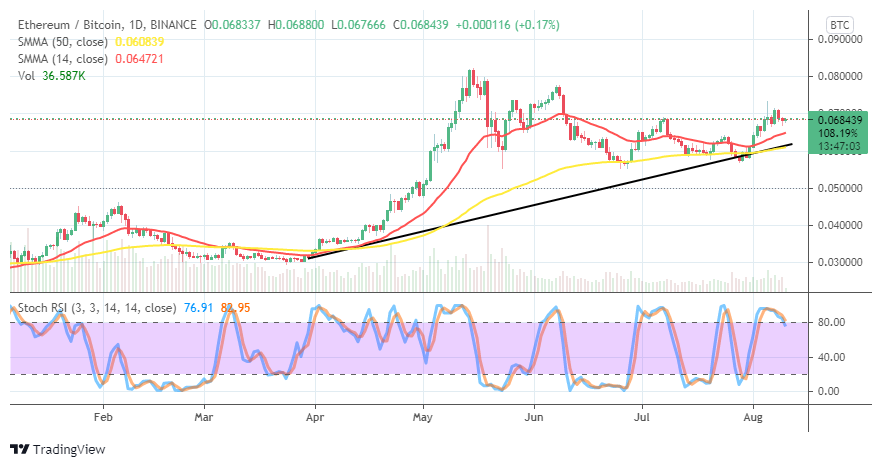
Comparing the trending weight of Ethereum versus Bitcoin on the daily price analysis, it appears that the base crypto slightly holds at a higher line. That means that ETH still outweighs BTC to some reasonable extent. The 50-day SMA trend-line is underneath the 14-day SMA trend-line as the bullish trend-line drew beneath the bigger SMA playing a supportive role. The Stochastic Oscillators have slightly crossed southbound against the range of 80. That suggests that the market may potentially witness a downward force.
Note: Crypto-academy.org is not a financial advisor. Do your research before investing your funds in any financial asset or presented product or event. We are not responsible for your investing results.
