


ETH Technical Analysis – December 2021
Monthly Analysis
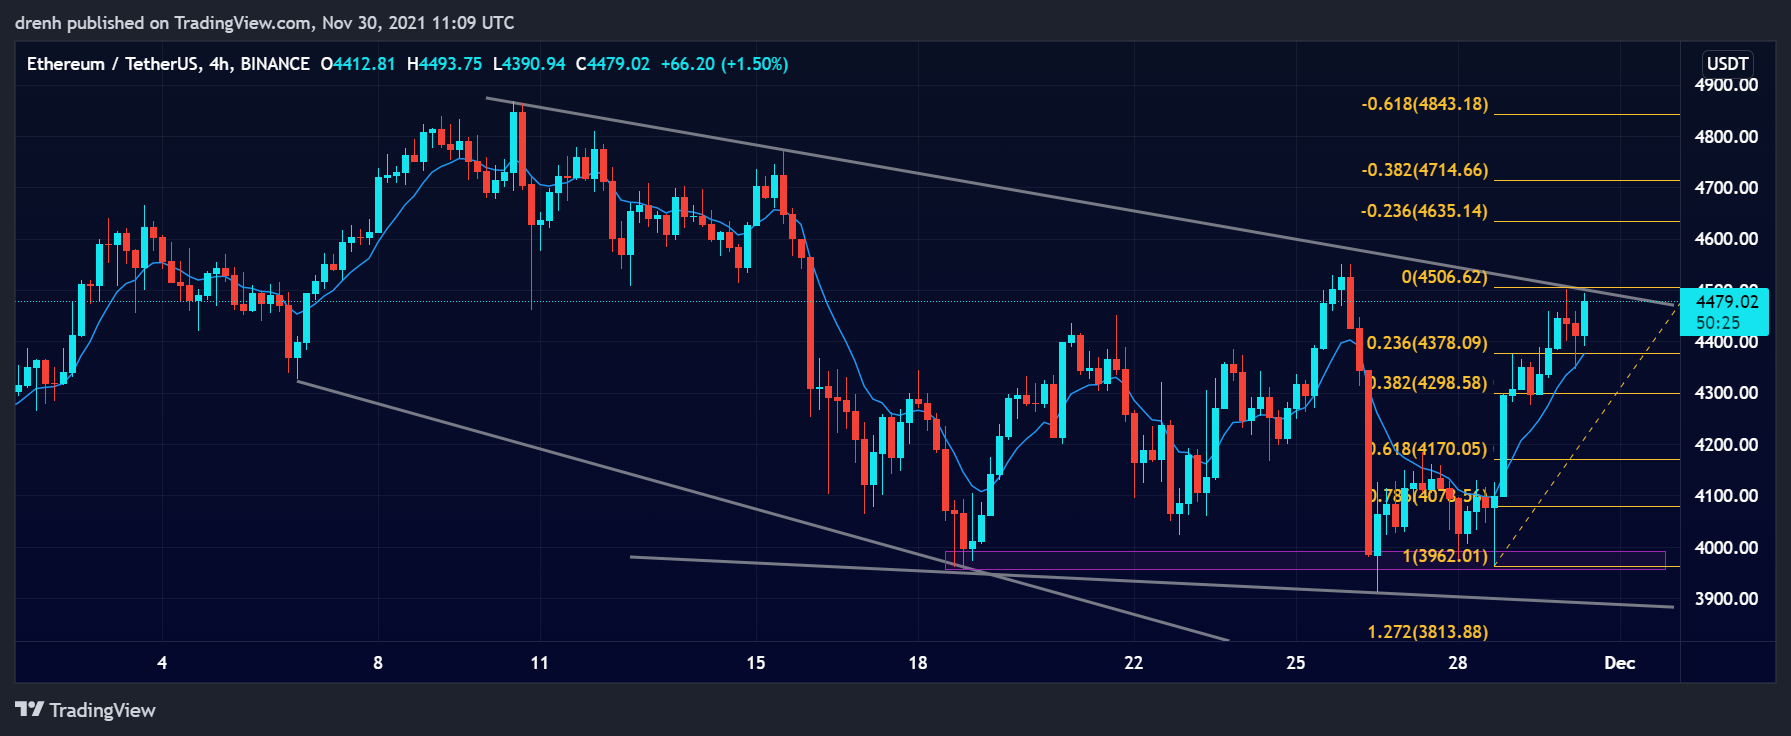
In the first 10 days of November, ETH was bullish and increased by 17%. This led to a new all-time high of ETH at $4,891. After that, the price of ETH started declining, and it dropped by around 18%. The price found support at $3,960. After that, another price increase of 15% was noticed before the price had a bearish breakout of 14%. The price has started increasing once again, but the current trend is bearish for ETH.

Weekly Analysis
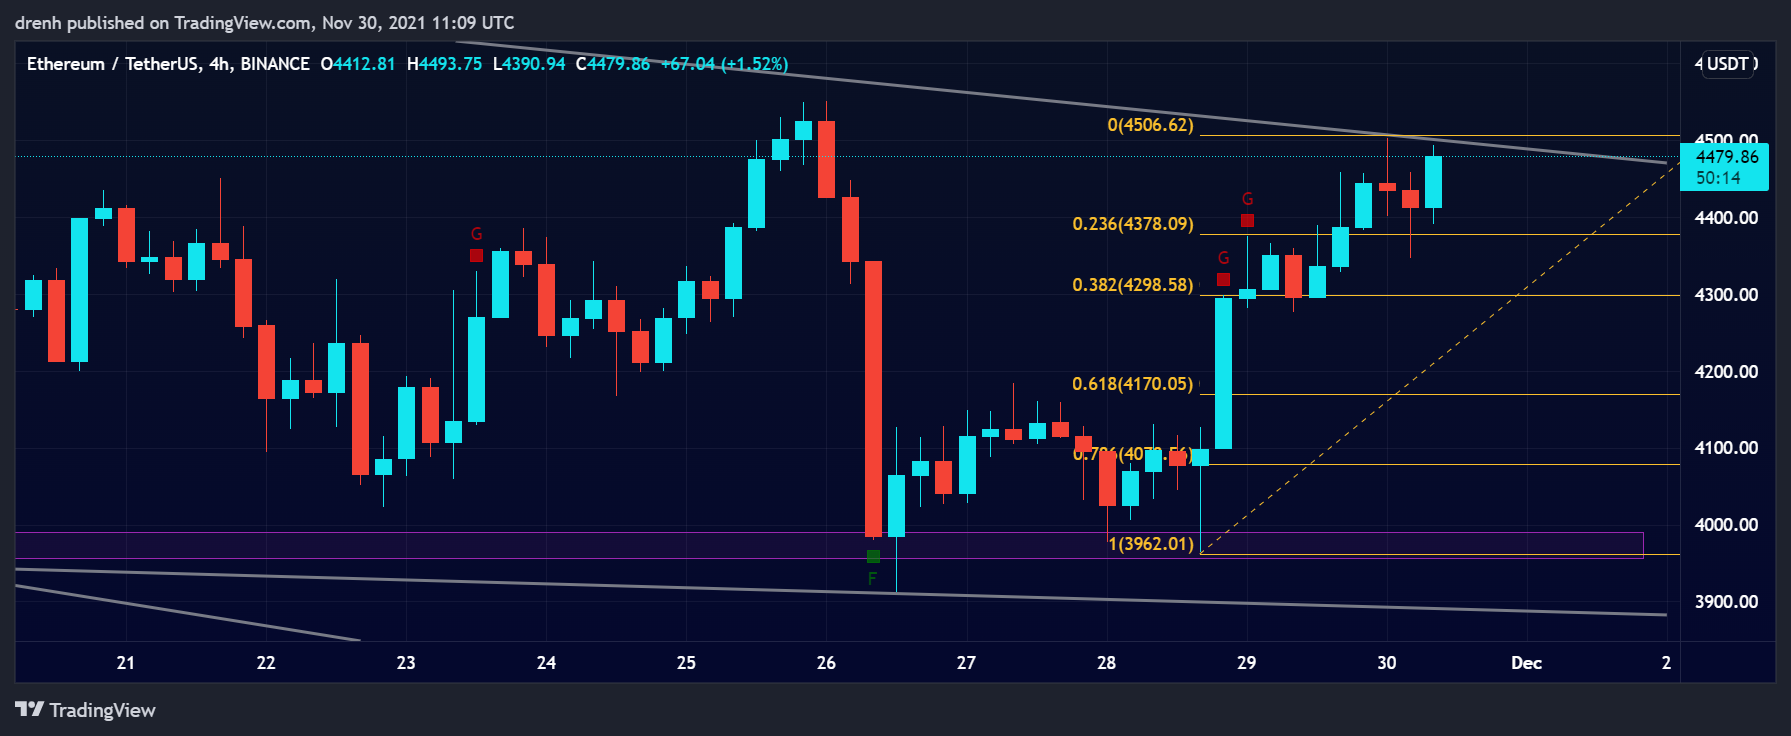
In the last 7 days, ETH initially increased before it dipped by 14%. The price found support at $3,912, and it has started increasing once again. We could see ETH face resistance soon as the price approaches the upper line of the trend.
Daily Analysis
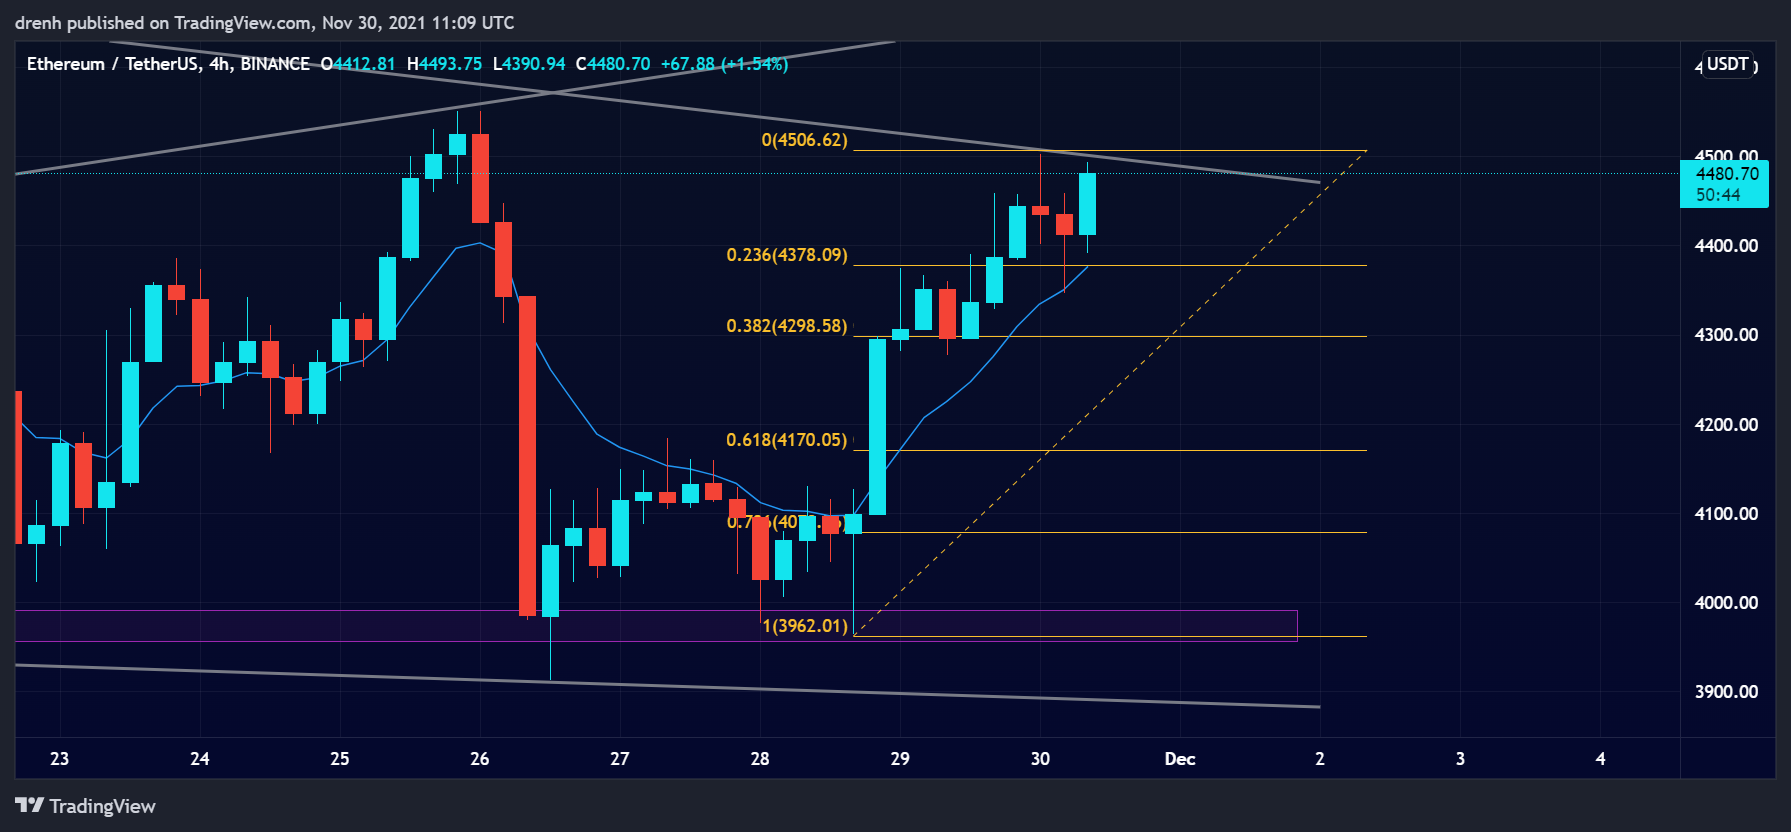
In the intraday chart, the price of ETH has been highly volatile as its price initially declined before having another surge upward. The short-term trend is bullish as the new highs in the intraday chart are higher than the previous highs.
Key Structures
Support
- $3,962
Resistance
- $4,550
Indicators
Moving Average
Due to the recent surge in the price of ETH, the 20-moving average in a 4-hour chart is now below the price, indicating that the trend is upward and that the price of ETH could keep increasing in the coming days.
The 9-EMA is also below the price due to the recent bullish movement of ETH, indicating that the price can increase in the short run and that the EMA line could act as support to the price.
Relative Strength Index
The RSI of a 4-hour chart is approaching 70, meaning that ETH might soon become overbought. This could see the price of ETH retrace a little before it continues to increase again in the coming days.
MACD
The MACD line of a 4-hour chart is above the signal line, indicating that the momentum is now bullish and that traders can move the price of ETH even higher in the short run.
Fear & Greed
The fear and greed indicator of a 4-hour chart suggests that the current emotion of ETH traders is greed, meaning that buyers have taken over and that ETH could keep increasing.
Fibonacci
The Fibonacci retracement levels suggest that the price of ETH could retrace to one of the levels in the coming days. The 61.8% level could prove to be a strong level of support as it also aligns with a previous support structure.

Price Prediction ETH – December 2021
Based on this technical analysis on Ethereum (ETH), we could see its price surpassing $4,600 in the coming hours. After that, a retracement could follow as ETH becomes overbought. Nonetheless, a bullish breakout breaks up the trend line and could reverse the trend for Ethereum. Its price could soon retest all-time high and aim even higher. If BTC continues its momentum, ETH could aim for $5,000 in the coming weeks. A price of $6,000 could be reached by the end of the month, while the target of $10,000 is attainable in the longer run.
Latest News for ETH – Affecting Price
Recently, there has been an increase in DeFi usage in the Ethereum network. This has led to the recent price increase of ETH. As DeFi becomes more accessible, ETH could increase even more in the coming weeks.
Also read: Ethereum Price Prediction 2021 and Beyond – Can ETH Reach $20,000 in 2021?