
- ETH/USD market attempts correctional movement.
- The crypto economy still keeps a bullish trend outlook.
- There are indications suggesting some upsides for the market operations.
The ETH/USD market operation attempts correctional movement around $3,000 and $3,500 after variant featuring price actions convergence. As of writing, the crypto’s price trades around a percentage rate of -0.87 to trade at about $2,989 level. The current downward formation of trading Japanese candlestick against the first value mentioned showcases that the crypto economy now faces the risk of more declines in the near time. The bullish trend-line drew to mark the point that price needs to breach southward to signal a continuation of the falling force.
Ethereum Key Zones
Resistance Levels: $3,400, $3,900, $4,400
Support Levels: $2,700, $2,500, $2,300
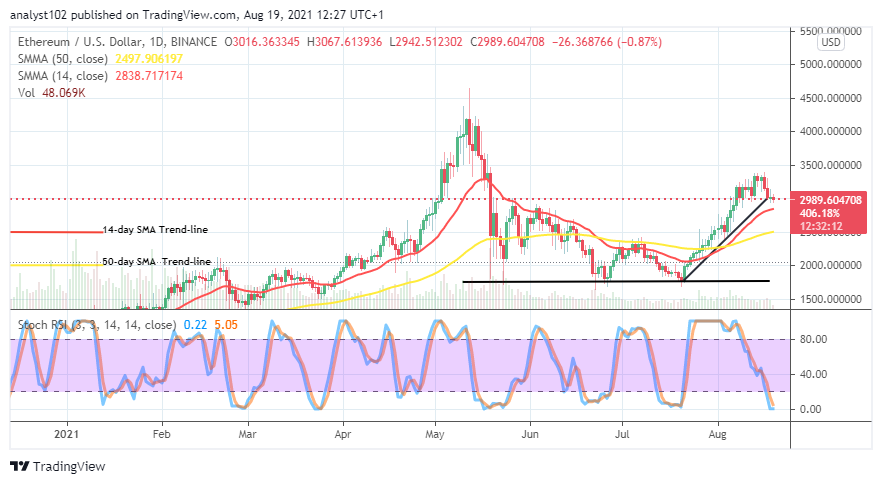
ETH/USD Long Term Trend: Bullish

In the first place, the crypto trend is still bullish as even the market operation attempts correctional movement. Price has somewhat gotten intensified in its current southward pressure to trade around the point at $3,000. And, it appears that the ETH/USD market bull may soon be getting set for a re-launch of its stance. If a bullish candlestick eventually emerges against the trading line mentioned after today’s session, the potential that the market regains the momentum will be.
Going by what the Stochastic Oscillators have brought out of readings, the downside force appears to lose the pace very soon. However, a consolidation of bearish motion around the $3,000 level may allow some degrees of downs to re-feature purposely to cause a line of panic sell-off trading situation. Going by what the Stochastic Oscillators have brought out of readings, the downside force appears, losing the pace very soon. However, a consolidation of bearish motion around the $3,000 level may allow some degrees of downs to re-feature purposely to cause a line of panic sell-off trading situation. The southward breaking of the 14-day SMA trend-line could, in the long run, cause an interception of the 50-day SMA to the downside. And, if that happens, it would mean a return of downward trend has once again come into operations.
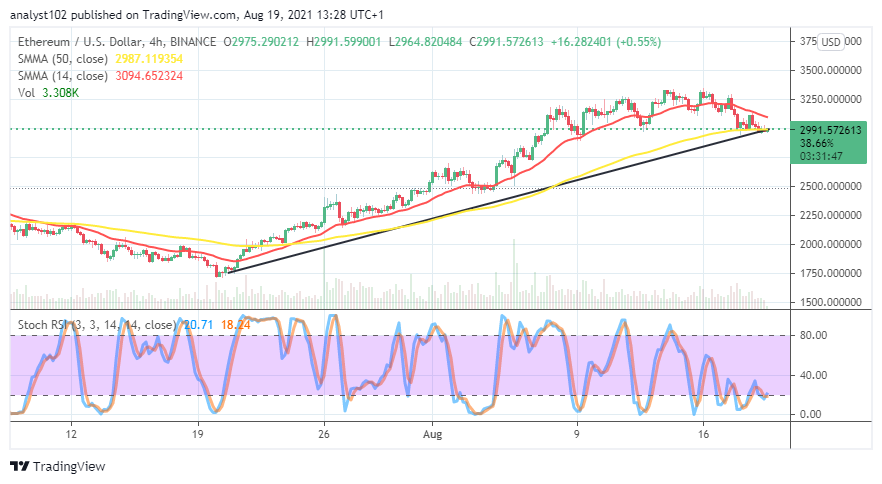
ETH/USD Short Term Trend: Bullish
Over several days of trading sessions, it is depicted on the ETH/USD 4-hour chart that the crypto market operation attempts correctional movement majorly around $3,250 and $3,000. Price began to feature around those points starting from August 7th until the present.
The 14-day SMA trend-line has briefly bent southward within those values above the 50-day SMA trend-line is at the lower line mentioned earlier. The bullish trend-line drew in a supportive manner to the bigger SMA indicator. The Stochastic Oscillators have seemingly been moving in a consolidation style between the range of 40 down into the oversold region, causing a slight indecision trading time.
All in all, the expectation is still high that the ETH/USD market bull will, in the end, regain momentum, especially while the 50-day SMA trend-line remains below the 14-day SMA trend-line.
Also read: 40k ETH Burned and Increased Rates Among the First Responses of Ethereum to EIP-1559
Note: Crypto-academy.org is not a financial advisor. Do your research before investing your funds in any financial asset or presented product or event. We are not responsible for your investing results.