


ETH Technical Analysis – September 2021
Monthly Analysis
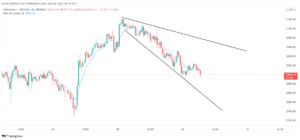
In the last 30 days, ETH initially increased by around 30%. This increase was then followed by 24%. Then, ETH rebounded, and it increased by another 22%. The price started decreasing again as it dropped by 28%. The price has been correcting over the last few days.
Weekly Analysis
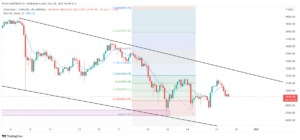
In the last 7 days, ETH has increased and decreased continually. It initially increased by 19%, but the price declined again and found support at $2730 on two occasions.
Daily Analysis
In the last few hours, ETH increased by around 2% and then declined by the same amount. The short-term trend is bearish, and it might indicate that the price could keep decreasing in the coming hours.

Key Structures
Support
- $2730
Resistance
- $3165
Indicators
Moving Average
The 20-day moving average is above the price of ETH, indicating that the trend is downward and that the price could keep decreasing in the coming days. The MA line could act as resistance.
The 9-day EMA is also above the price, indicating bearish tendencies. The EMA line may also resist potential price increases in the coming days.
Relative Strength Index
The RSI of a daily chart is below 50 and at around 40, indicating that the momentum is bearish. However, it also suggests that ETH has room for growth. The same applies to the RSI of a 4-hour chart.
MACD
The MACD line is below the signal line and below the baseline, indicating that the momentum is bearish. This might mean that the price of ETH could keep decreasing. In a 4-hour chart, the MACD line was recently above the signal line but the two have now intersected, where the MACD line is going below. This suggests that the price could decrease in the short term.
Fear & Greed
The fear and greed indicator suggests that the current emotion for ETH traders is fear due to the recent decline.


Fibonacci
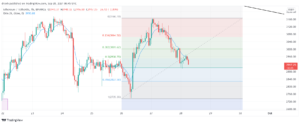
The Fibonacci retracement level in a 4-hour chart suggests that ETH retraced to 61.8% in a recent price decrease. This might mean that ETH could aim for the Fibonacci extension levels.

In the recent upwards movement in a 1-hour chart, ETH retraced to 61.8%, meaning that the price could increase in the coming hours.

Price Prediction ETH – September 2021
Based on this technical analysis, we could see ETH go down in the coming days and retest support at $2735, and it may eventually go as low as $2650. If buying pressure is strong and ETH goes upwards, we could see ETH surpass $3200 in the coming days.
Latest News for ETH – Affecting Price
China’s recent decision to make crypto-related transactions illegal has adversely affected the price of ETH, BTC, and other major cryptocurrencies. Nonetheless, some argue that it may not necessarily disturb the market in the longer term. Furthermore, Ethereum NFTs can now also be on Solana due to the ETH-SOL bridge known as Wormhole. This can have a positive influence on the price of both.
Also read: Ethereum Price Prediction 2021 and Beyond – Can ETH Reach $20,000 in 2021?