


ENJ Technical Analysis – October 2021
Monthly Analysis
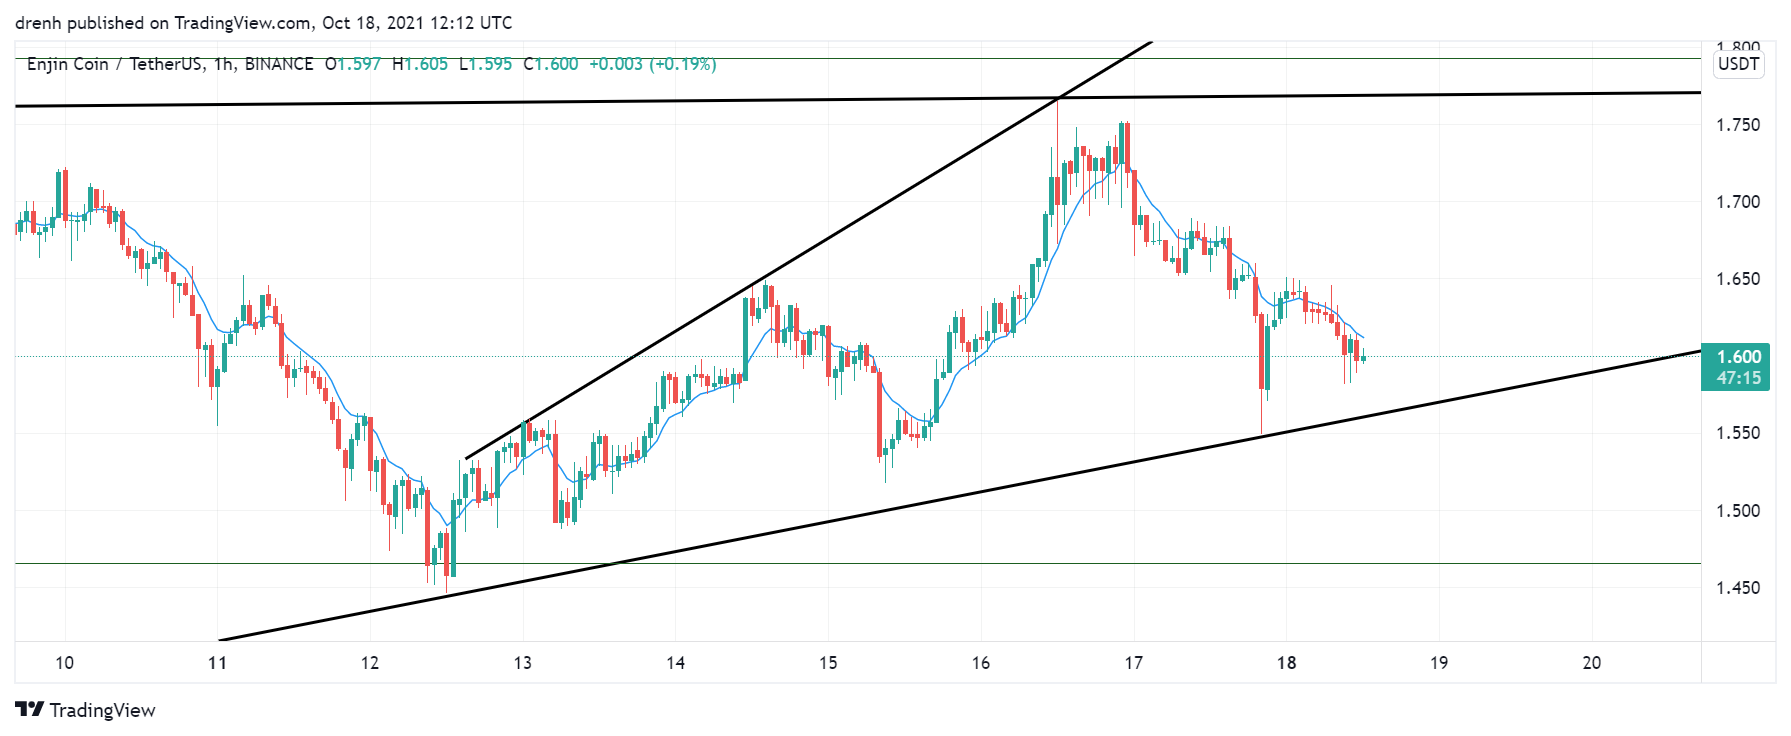
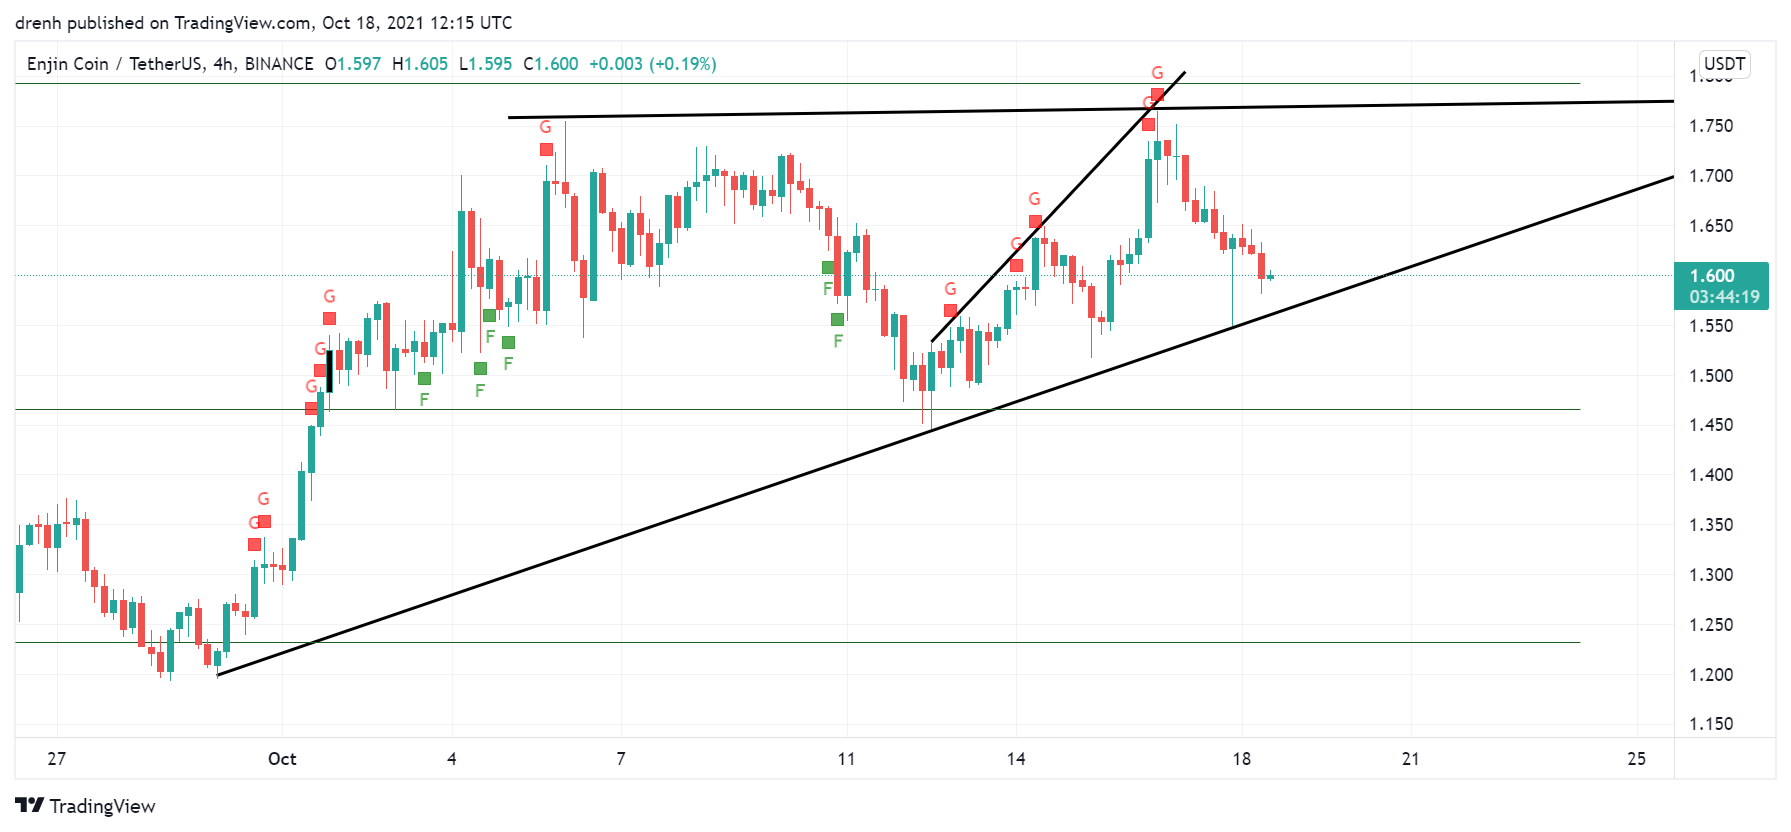
Over the last 30 days, ENJ has declined by around 32%. After finding support at $1.2, the price started increasing again. It increased by 47% and then hit resistance at $1.76. The price has started declining again.
Weekly Analysis
In the last 7 days, ENJ has been bullish. Its price has increased by 22% in the last few days. In the last couple of days, the price has retraced by 4%. This means that in the shorter term, ENJ is bearish, but it is still bullish.

Daily Analysis
In the intraday chart, ENJ has been bearish. Its price could decline judging by the downtrend in the 30-minute chart.
Key Structures
Support
- $1.45
Resistance
- $1.77
Indicators
Moving Average
The 20-day moving average is currently below the price. It is currently acting as support, and it indicates that the price could keep increasing in the coming days if today’s candlestick closes above the MA line.
The 9-day EMA has recently moved below the price, indicating that the trend is upward, but the recent price is above the EMA line. This could mean that the trend is now downward and that the price could decline in the short run.
Relative Strength Index
The RSI is fairly average in a daily chart, and it has also slightly declined recently, indicating that the selling pressure is increasing. In a 4-hour chart, the RSI is even more bearish as it is approaching the oversold region.
MACD
The MACD line is slightly above the signal line and above the signal line. However, they could converge soon and the momentum might change. In a 4-hour chart, the MACD line is below the signal line and heading below the baseline. This indicates that the momentum is bearish and that the price could keep decreasing in the short run.
Fear & Greed
The fear and greed indicator suggests that the current emotion of ENJ traders is greed due to the recent uptrend.

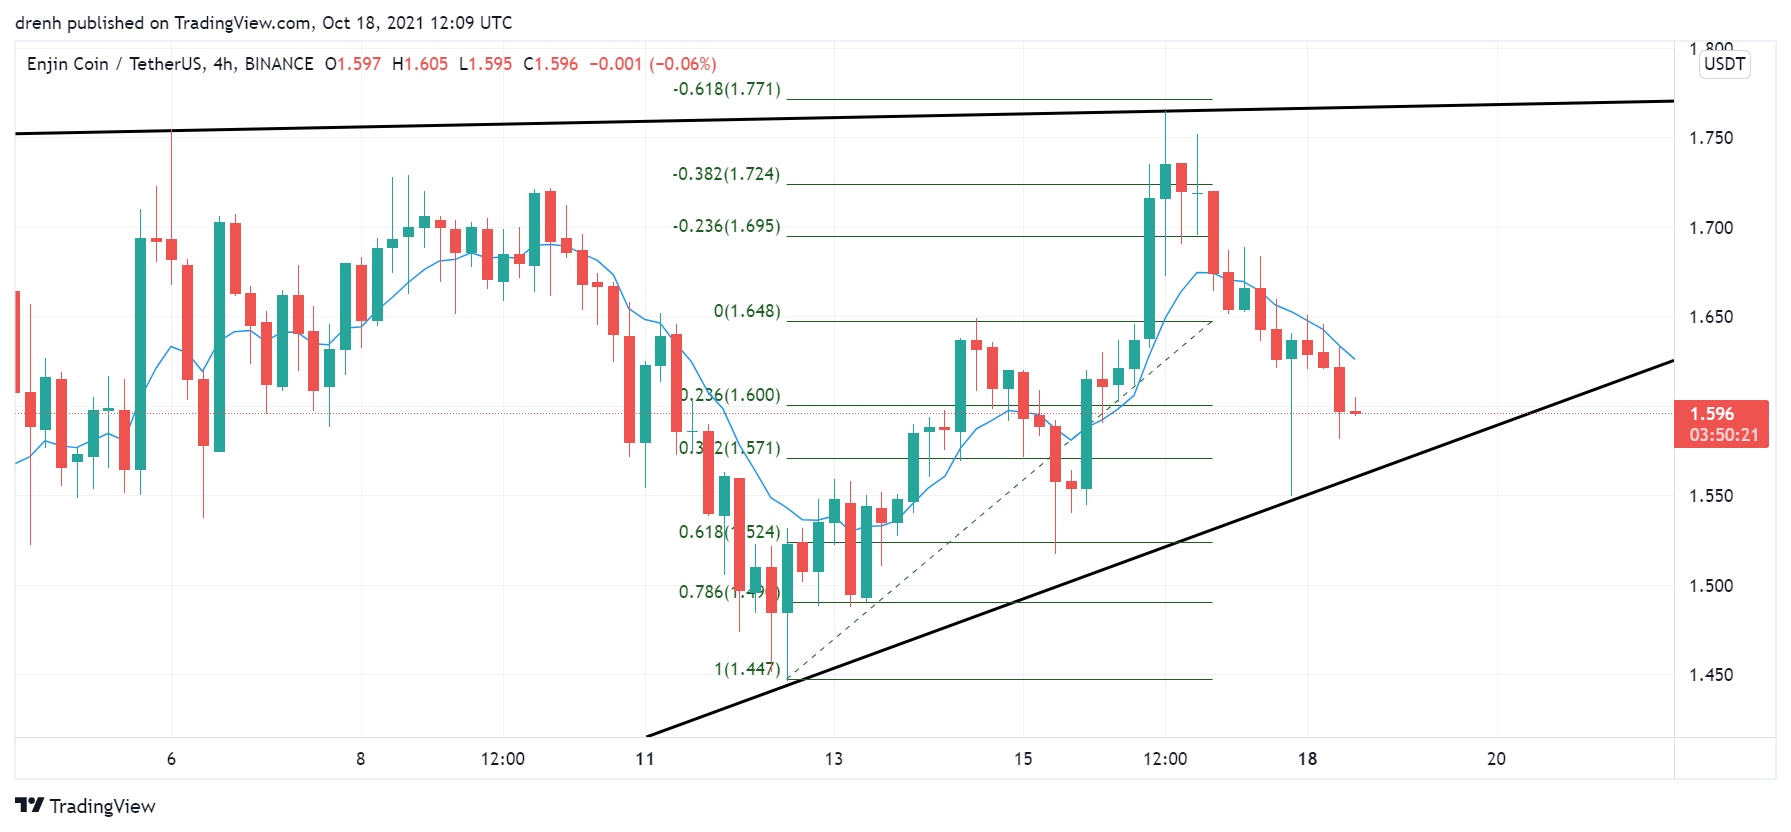
Fibonacci
The Fibonacci retracement levels in a 4-hour suggest that the price has retraced to the 61.8% level, and then it surpassed the 38.2% extension level.
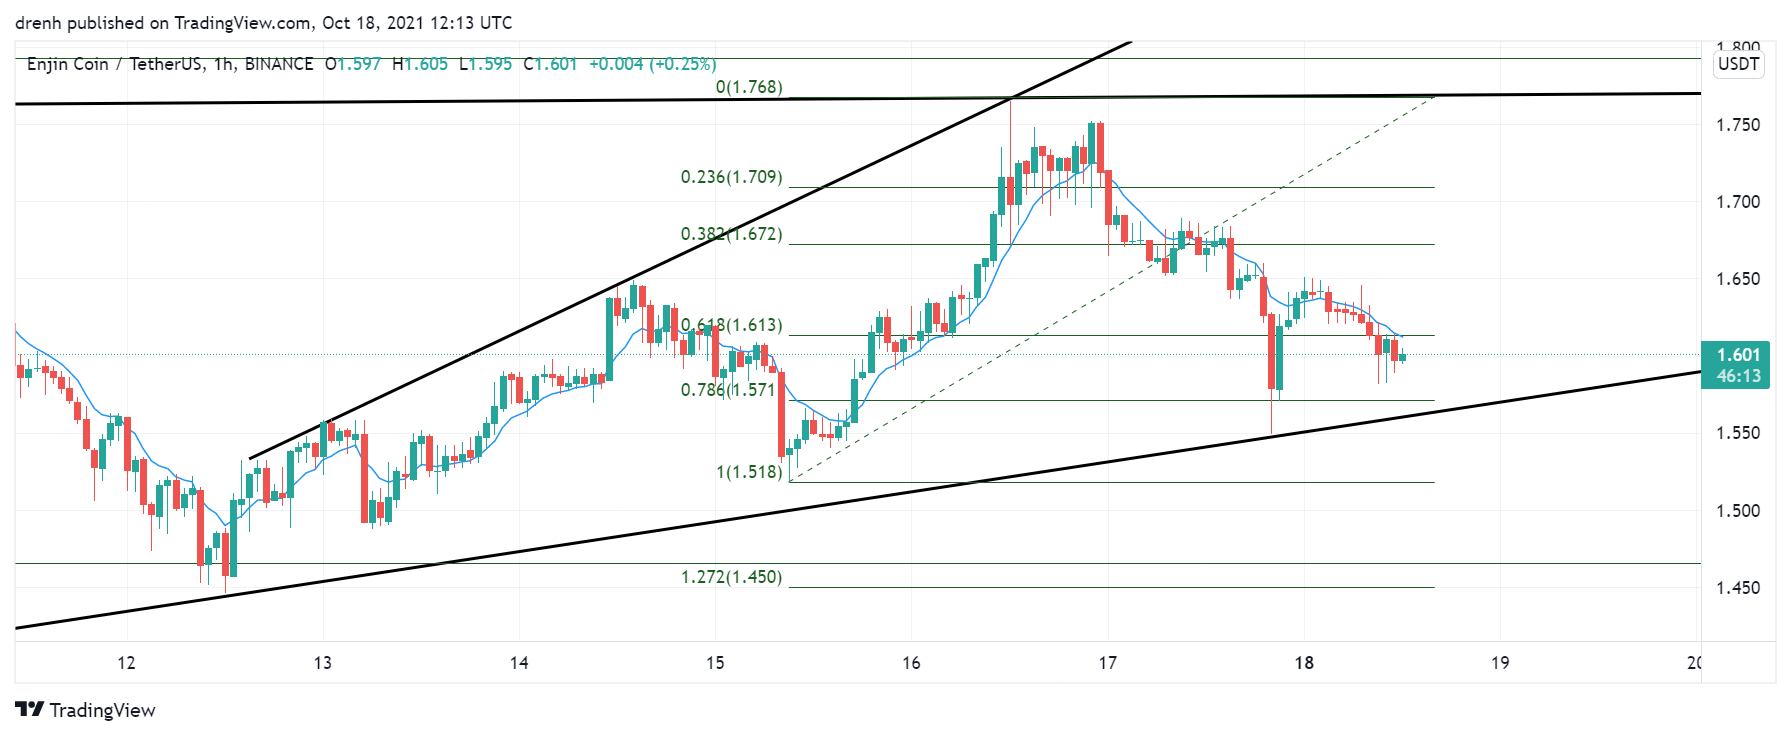
In a 1-hour chart, the price has recently found support at 78.6%. This could see the price of ENJ go upward to 0% in the coming hours.
Price Prediction ENJ – October 2021
Based on this technical analysis on ENJ, its price could increase and retest resistance at $1.77. If resistance is broken and BTC keeps increasing at the same rate, then ENJ could reach a new all-time high. Eventually, ENJ could aim for $5 in this quarter.
Latest News for ENJ – Affecting Price
Recently, Steam has decided to ban crypto-based games. This could affect Enjin Coin since it is a project that focuses on decentralized gaming. The price of ENJ could be adversely affected by this decision.
Also read: Enjin Coin Price Prediction 2021 and Beyond – Is ENJ a Good Investment?