


EGLD Technical Analysis – October 2021
Monthly Analysis
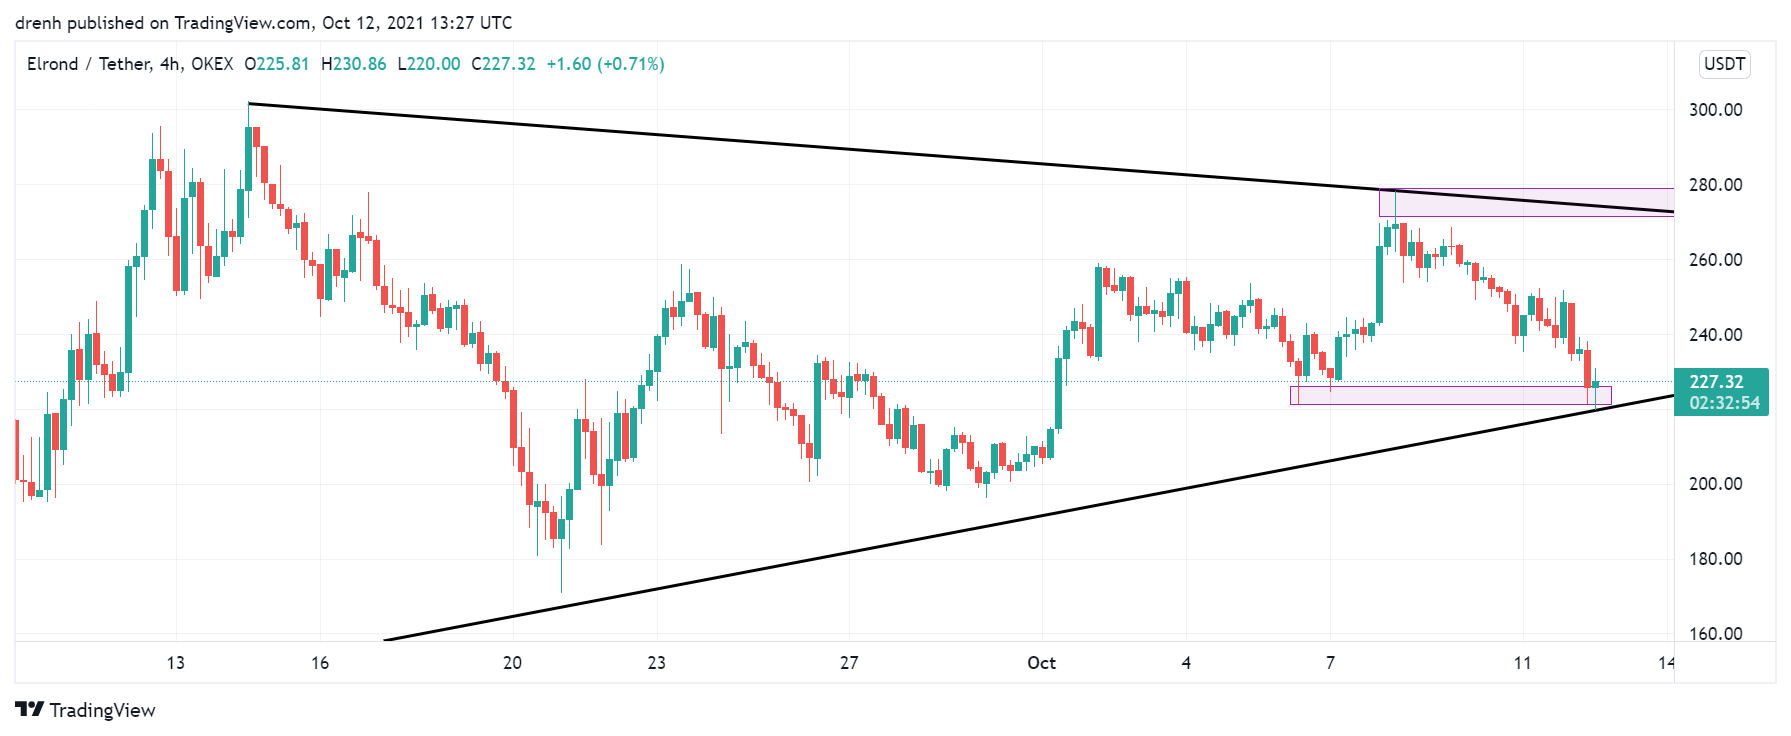
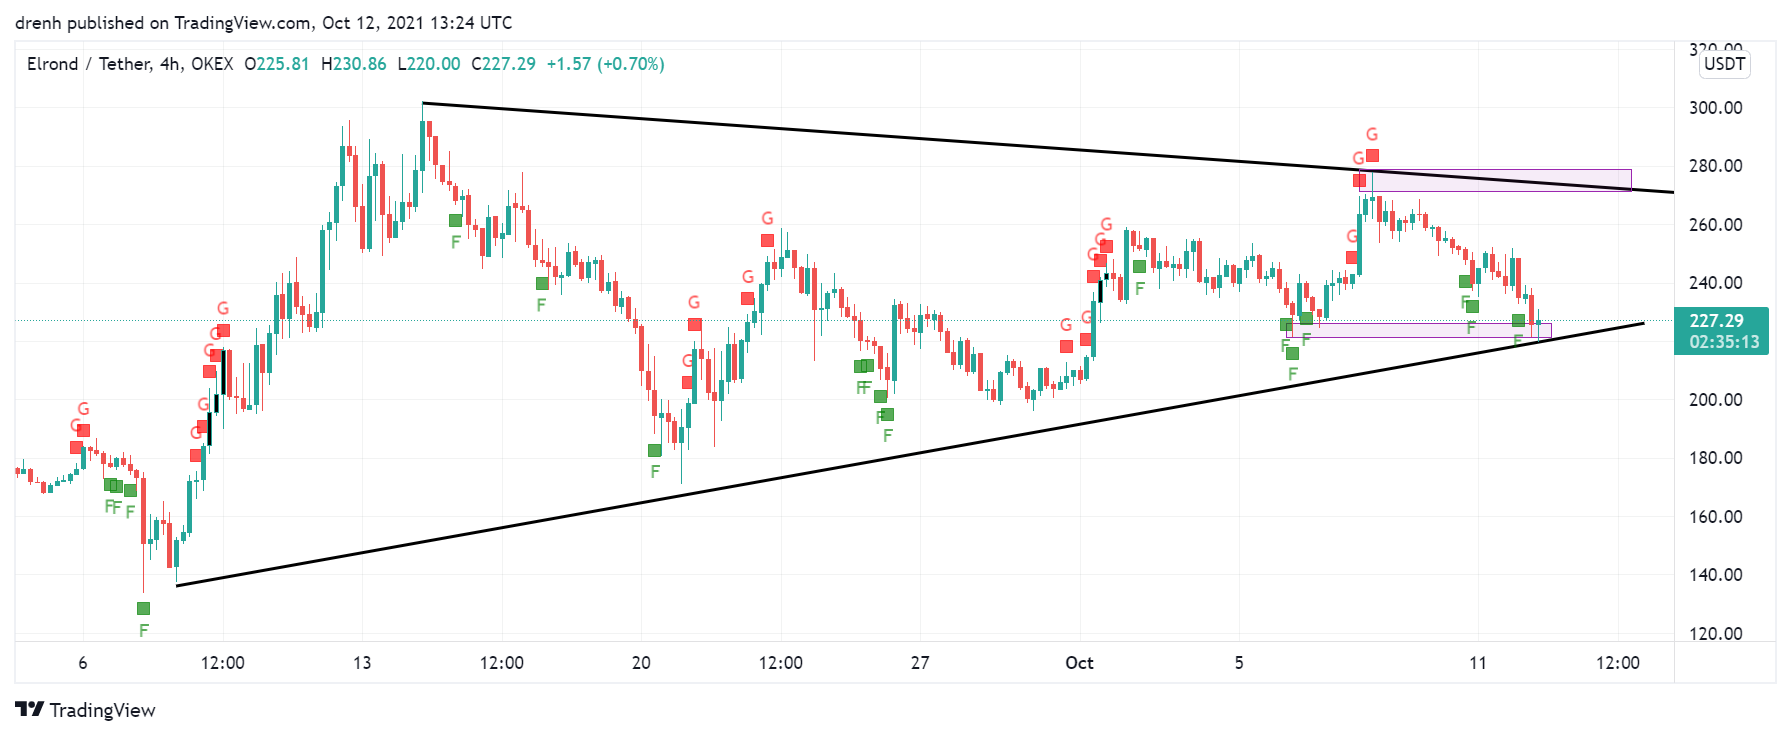
In the last 30 days, EGLD initially decreased by 43%. After that, EGLD found support at $170. Then, the price started increasing again, and it has increased by 60% in the weeks that followed. Nonetheless, EGLD saw resistance at $278. Recently, a pullback has occurred for EGLD. Nonetheless, the price looks bullish for EGLD. An ascending triangle pattern has taken shape, indicating that a bullish breakout could potentially occur soon for EGLD.

Weekly Analysis
In just the last 7 days, EGLD increased by 25%. However, a pullback of 21% in the price of EGLD followed, as the shorter-term trend became bearish. Nonetheless, EGLD is looking to finds support at $220 in ord to follow its bullish run in the coming days.

Daily Analysis
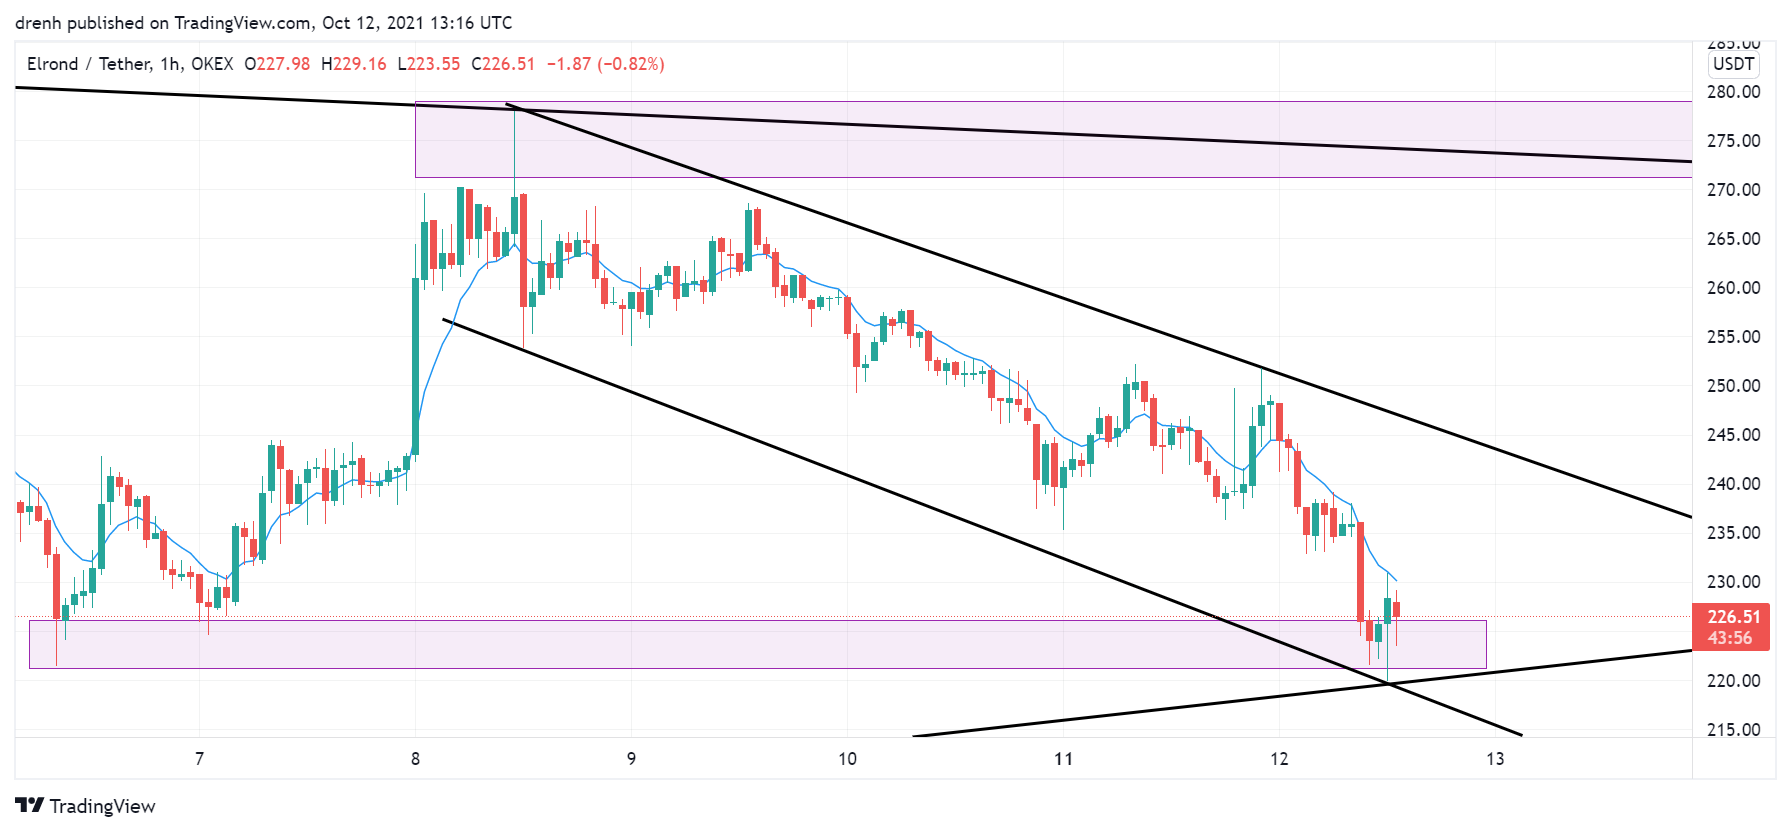
In the intraday chart, EGLD has been bearish, where the price has decreased by around 11%. In the intraday chart, the price recently found support at around $220, and it now may increase in the coming hours.
Key Structures
Support
- $197
Resistance
- $302
Indicators
Moving Average
The 20-day moving average indicates that the MA line is slightly above the current price. However, if the daily candlestick closes above the MA line, then EGLD could maintain its bullish nature.
The 9-day EMA is also above the price, meaning that the shorter-term trend is bearish for EGLD and that the EMA line could act as resistance. This could see the price of EGLD decrease in the short run.
Relative Strength Index
The RSI of the daily chart has declined due to the recent pullback and is now close to 50. This suggests that the price has space for both increasing or decreasing in the coming days. In the 4-hour chart, the RSI is bearish and close to the oversold region, but it has slightly increased due to the recent movement.
MACD
The MACD line of a daily chart is slightly below the signal line after recent convergence. This could mean a shift in the momentum of EGLD. in a 4-hour chart, the MACD line is below the signal line, indicating that the momentum is bearish for EGLD.
Fear & Greed
The fear and greed indicator suggests that the current emotion of EGLD traders is fear due to the recent pullback. However, excessive fear oven leads to bullish breakouts.
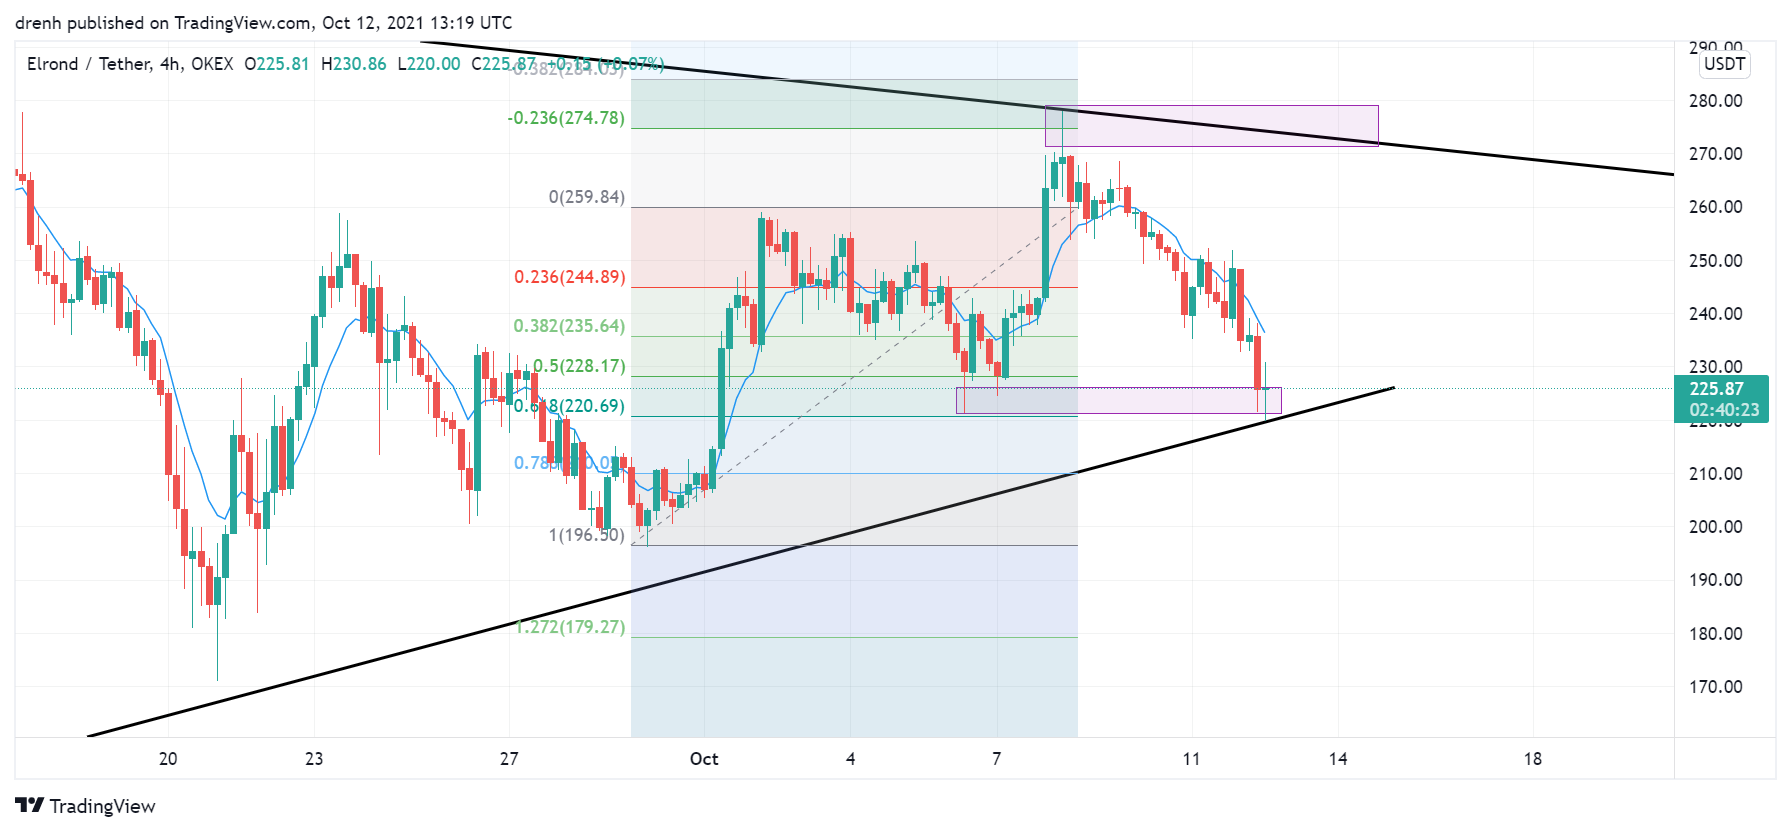
Fibonacci
The Fibonacci retracement level suggests that the price has recently retraced close to the 61.8% level. After that, the price of EGLD aimed at the 23.6% extension level, suggesting that Fibonacci was respected.
Price Prediction EGLD – October 2021
Based on this technical analysis on Elrond (EGLD), the price of EGLD could increase in the coming days as the longer-term trend is still bullish. Since the all-time high was recently reached and traders are generally bullish, EGLD could break its all-time high soon. A bullish breakout could see EGLD holders (HODLers) make huge profits, where the price could even go for $500 in the coming weeks, other things equal. This could all be determined from the price movement of Bitcoin (BTC).
Latest News for EGLD – Affecting Price
Recently it was announced that a Cardano-Elrond bridge infrastructure is being built in the DeFi sector. This could greatly affect the price of both cryptocurrencies as these are two of the most promising cryptocurrencies in the market.
Also read: Elrond (EGLD) Price Prediction 2021 and Beyond – Is EGLD a Good Investment?