

EGLD Technical Analysis – August 2021
Daily Analysis
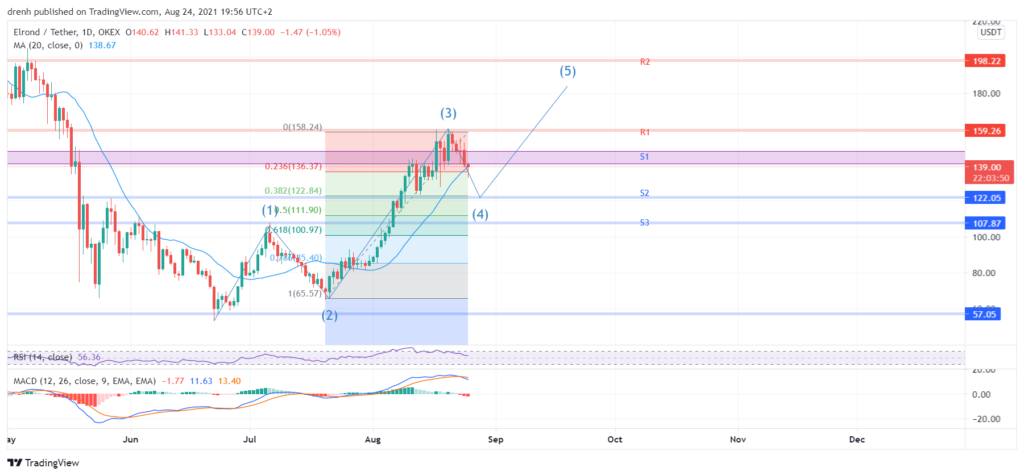
Once again, Elrond has been bullish over the past few days. In the last couple of days, there has been a slight pullback since EGLD failed to surpass the resistance, but it may soon find support at around $140. During this uptrend, EGLD has increased by about 180%, and it might aim to get closer to $200 if support zones stop a reversal and resistance is broken.
Intraday Thoughts
When looking at a shorter time frame, the intraday view on EGLD still suggests quite a bullish nature. Cryptocurrencies are known for their high volatility, and this has also been the case with EGLD in the last few days.

Key Structures for ELROND
Support
- $141, $121, $107
Resistance
- $159, $200, $230
Indicators
Moving Average
The 20-day moving average is well below the candlesticks, indicating that the uptrend may continue. Furthermore, despite potential pullbacks, EGLD might find support at its moving average.
The 50-day moving average is even more bullish and may suggest for the trend to continue at this rate in the weeks to come, other things equal.
Relative Strength Index
The Relative Strength Index (RSI) has not been very favourable in the past few days, as it exceeded 70. Since EGLD was overbought, traders started selling it, causing the pullback on which we are currently in. Nevertheless, the RSI today is close to 60. If EGLD finds support at a lower price, it might be a good time to buy since the RSI might go even lower.
MACD
As for the Moving Average Convergence Divergence (MACD), the two lines have just intersected, where the signal line might be above MACD. This also relates to the pullback that EGLD is recently in (if it’s not a reversal). MACD is still above its baseline, but it may very soon get below it.
Fibonacci
When looking at the Fibonacci retracement levels, the 38.2% zone is at $121. If EGLD does not find support at $141, where the previous resistance used to be, $121 might be due to the Fib. calculations and previous support and resistance levels at that very price range.

Elliot Waves
When looking at the Elliot Waves, the first impulsive wave closed at $102. The correction follower, going as low as $65. The third Elliot wave is the recent high of EGLD, and it reached close to $160. If the correction follows, EGLD might not go below the highest point of the first impulsive wave, meaning that the support at $107 is assured judging from the Elliot wave, only if support fails at $121. Then, the last wave can see EGLD go past the previous high.

Price Prediction Elrond – August 2021
Let’s say EGLD finds support and jumps back up to its current resistance. A double top pattern might be the very first indicator that a reversal is going to occur. However, if EGLD goes over the recent high, EGLD might as well be expected to reach $200 again in the next 4-5 weeks.
Latest News for Elrond – Affecting Price
Despite technicalities that come with the price of EGLD, its price may also be viewed from a fundamental standpoint. In terms of recent news, Elrond has received support from HUMAN Protocol, a company that works with AI and bot technology. HUMAN Protocol has identified Elrond as one of the most suitable blockchain networks for reinventing marketplaces and the human-robot working relation. Such actions are the primary reason why a cryptocurrency might increase. If other investors realize this, the demand for EGLD may increase.
If you want to learn more about the fundamentals of Elrond (EGLD), check out this article:
Elrond (EGLD) Price Prediction 2021 and Beyond – Is EGLD a Good Investment?