

ELON Technical Analysis – December 2021
Monthly Analysis
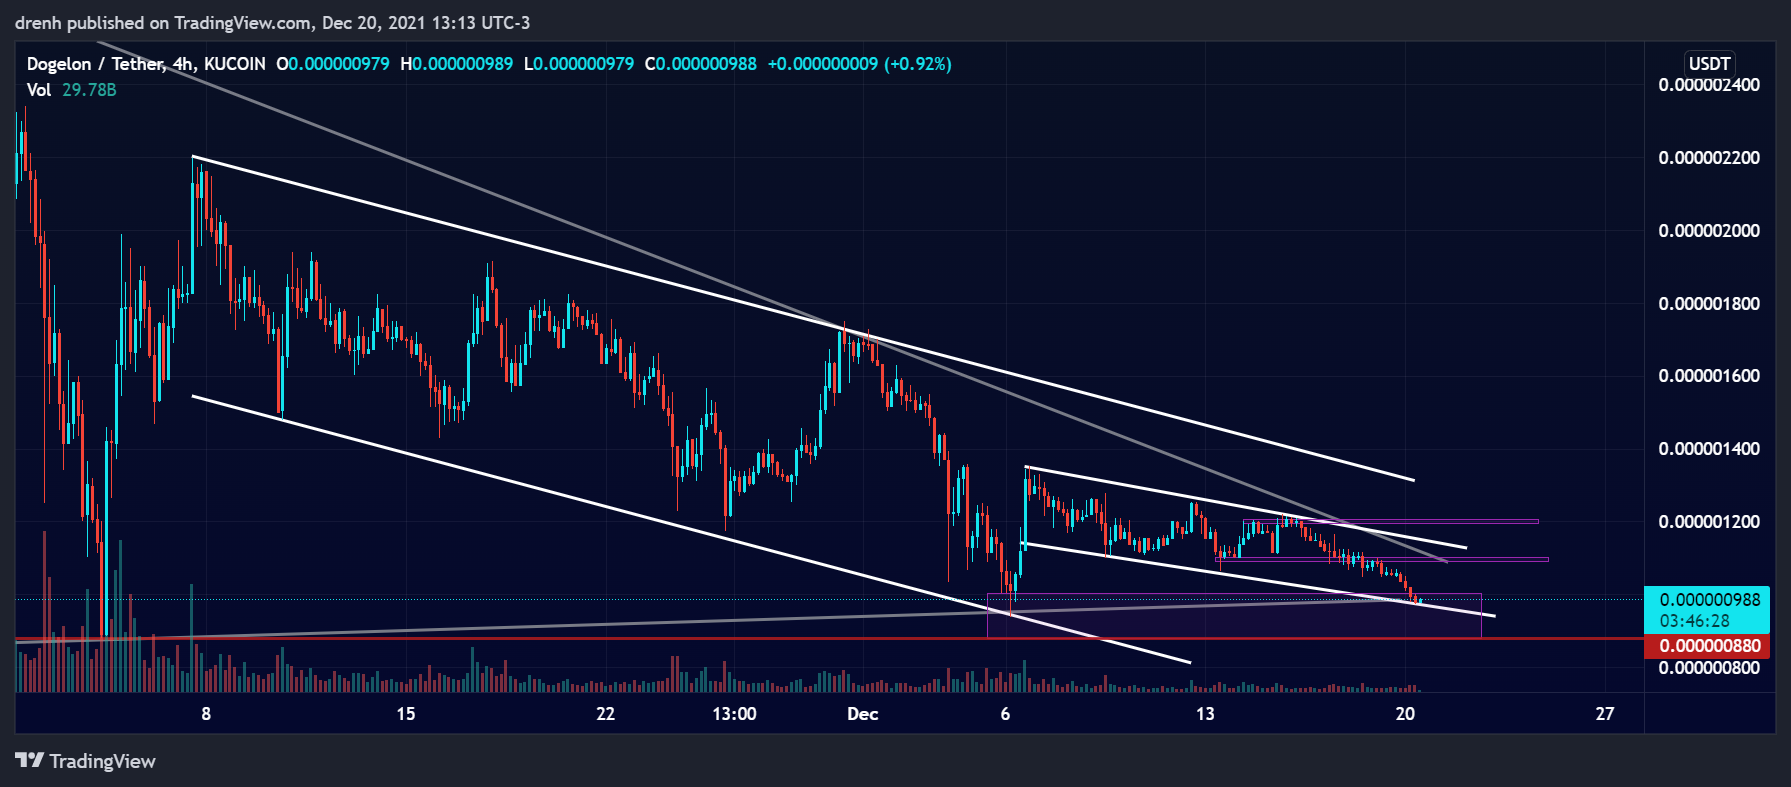
In the last 30 days, ELON has been bearish as the price declined by around 51%. The price found support at $0.0000009. After that, the price had an impulsive wave of 45%, but it faced resistance at $0.0000013. Dogelon Mars continued its bearish run after that, and the price could keep declining in the coming days.

Weekly Analysis
In the last 7 days, the price of ELON has been bearish. It has declined by more than 20% in just the last few days. The price could keep declining in the coming days as well as the downtrend continues for Dogelon Mars.
Daily Analysis
Last but not least, the price of ELON has been bearish in the intraday chart as well. It has declined by around 7% in the last few hours. Nonetheless, it has shown some bullish tendencies in the last couple of hours, suggesting that the price of ELON might be in correction soon.
Key Structures
Support
- $0.0000009
Resistance
- $0.0000013
Indicators
Moving Average
The 20-MA line of a 4-hour chart is currently above the price of ELON, indicating that the trend continues to be downward and that the price of ELON could keep declining in the coming days.
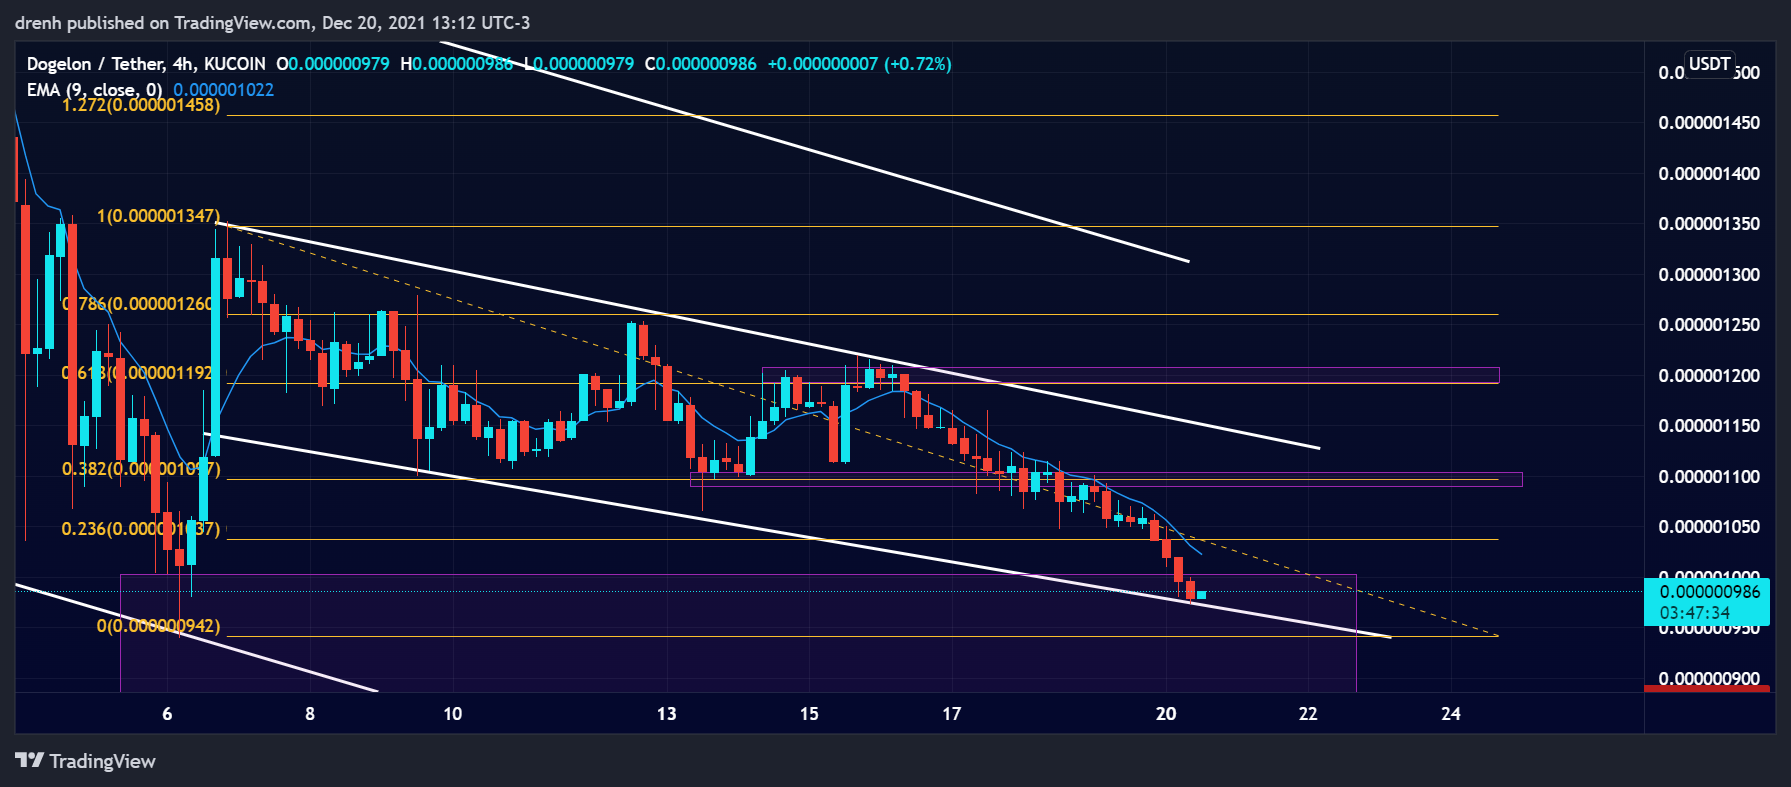
The 9-EMA of a 4-hour chart is also currently above the price of ELON, indicating that Dogelon Mars remains bearish and that the EMA line could act as resistance to the price if it attempts to increase in the short run.
Relative Strength Index
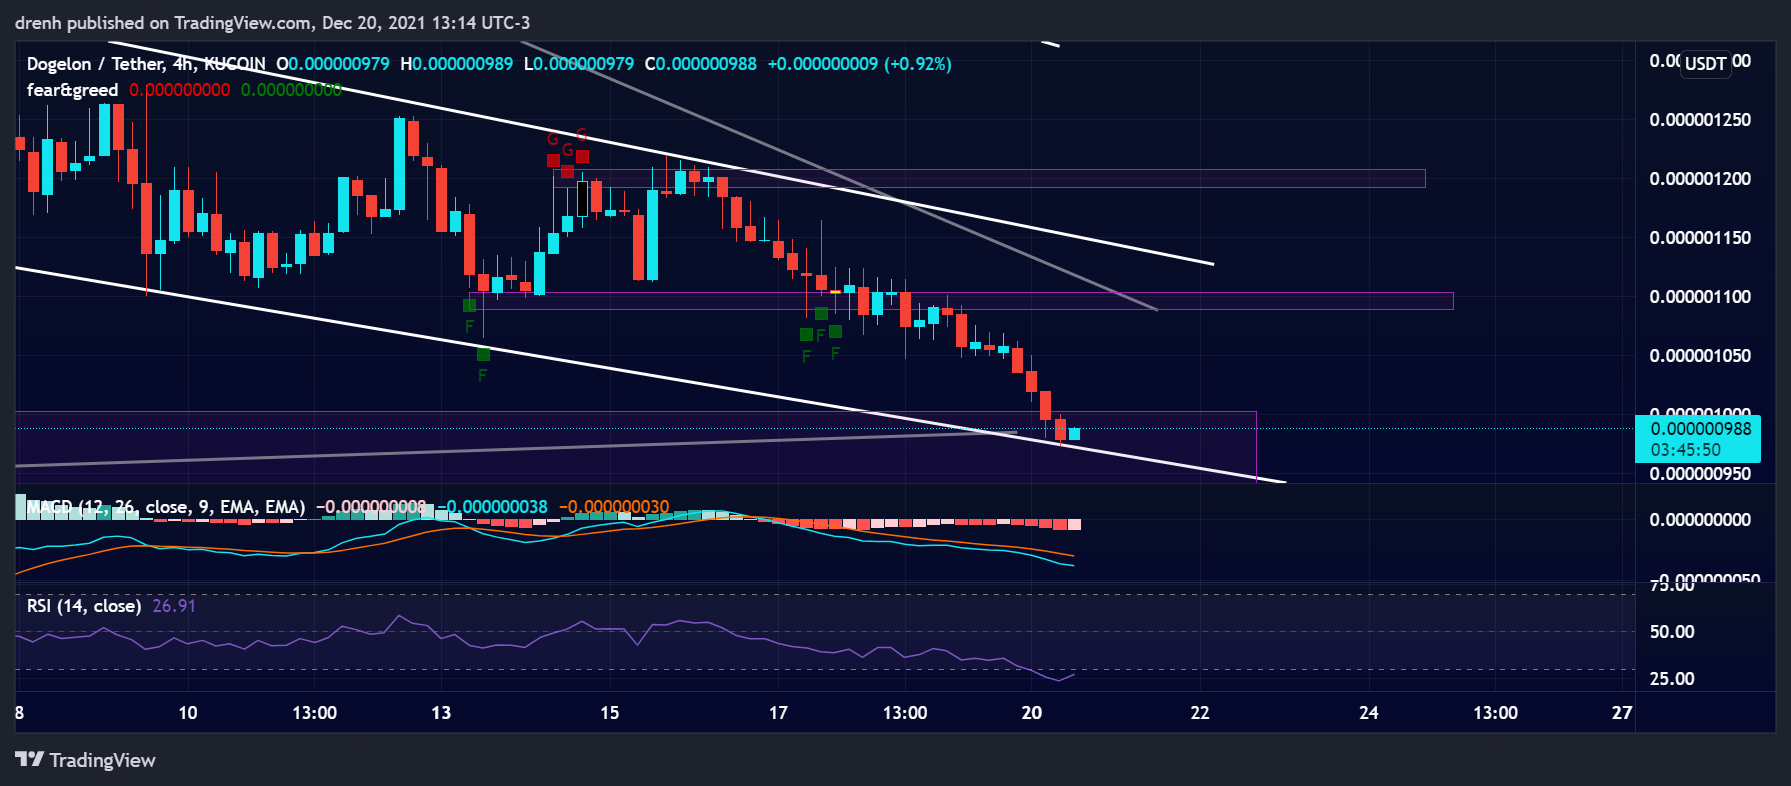
The RSI of a 4-hour chart is slightly below 30, indicating that ELON has become oversold. This could lead to either a reversal or simply a bullish breakout. We could expect the price to have a correction until the RSI is within the 30-70 range once again.
MACD
The MACD line of a 4-hour chart is below the signal line and below the baseline, indicating that the current momentum is bearish for Dogelon Mars. The lines have started to slightly converge, however, showing signs of less buying pressure in the 4-hour chart.
Fear & Greed
The fear and greed indicator of a 4-hour chart suggests that the current emotion of ELON traders is fear due to the recent price decline. However, excessive fear is often the best time for a cryptocurrency to start a reversal.

Fibonacci
The Fibonacci retracement levels of a 4-hour chart suggest that if the price of ELON finds support soon at our projected structure, it could then retrace to either the 38.2% or 61.8% level, as they both could be strong structures due to the alignment with previous structures.
Price Prediction ELON – December 2021
Based on this technical analysis on Dogelon Mars (ELON), its price could soon find support at around $0.0000009. After that, the price could have an impulse wave to around $0.0000011 and then continue going down unless that resistance is broken. With fear building up for Dogelon Mars, investors could take advantage and attempt to take over by buying. This would lead to a price reversal in the coming weeks, other things equal. Nonetheless, ELON could still reach a new all-time high in the longer run.
Latest News for ELON – Affecting Price
Dogelon Mars has recently announced that the ELON token is now part of the Syn City metaverse, which is a Mafia-related game. This could boost the price of the ELON token upward as the game gets more exposure.
I have traveled across the cosmos and through various dimensions. Throughout all my travels, Syn City @SynCityHQ has always felt like home.
The ELON gang take over begins!
Join here! https://t.co/aF4ipwQlZmStay tuned for some exciting updates!$ELON #dogelonmars #elonmafia https://t.co/z38OE1hD1L
— Dogelon Mars (@DogelonMars) December 17, 2021
Also read:
Dogelon Mars Review – Is Dogelon Mars (ELON) a Good Investment?
Dogelon Mars (ELON) Price Prediction 2022 and Beyond – Can ELON Eventually Hit $1?
Dogelon Mars Price Prediction 2025 – How High Will ELON Go?
Dogelon Mars Price Prediction 2030 – What Will ELON Price be in 2030?
How to Buy Dogelon Mars – A Step-By-Step Guide
Where to Buy Dogelon Mars Coin in USA? – The Best Exchanges to Buy ELON in USA