


OMI Technical Analysis – December 2021
Monthly Analysis
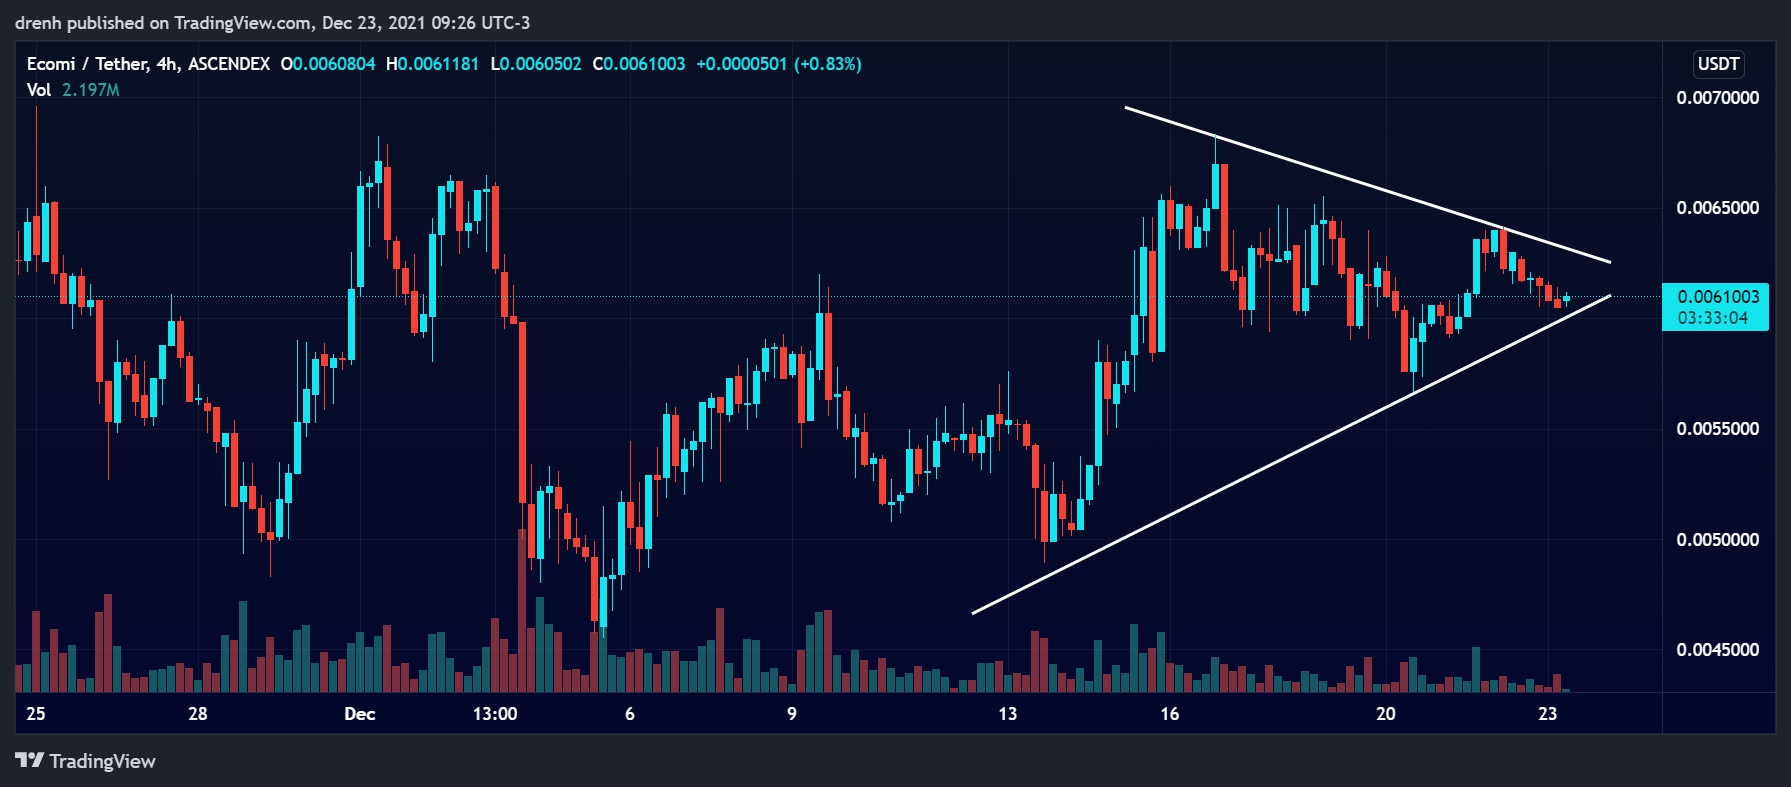
The price of OMI was highly volatile in December. The price fluctuated from $0.007 to $0.004 continuously, suggesting that these two zones provided strong resistance and support, respectively. Recently, the price has formed a triangle pattern, hinting at a possible breakout in the coming days.

Weekly Analysis
In the last 7 days, the price of OMI was slightly bearish, as the price declined by around 17%. Nonetheless, the recent triangle pattern that has formed could see the price of OMI have a bullish breakout soon. This would potentially break the trendline as OMI is looking to have another go upward.
Daily Analysis
In the intraday chart, the price of OMI has been volatile as well. It has declined by around 5% in the last 24 hours, but it may soon find support and head upward in the coming hours. Overall, the intraday chart was bearish for OMI.
Key Structures
Support
- $0.0056
Resistance
- $0.0068
Indicators
Moving Average
The 20-MA line of a 4-hour chart is slightly below the price, indicating that the trend could now reverse and that the price of OMI could increase in the coming days.
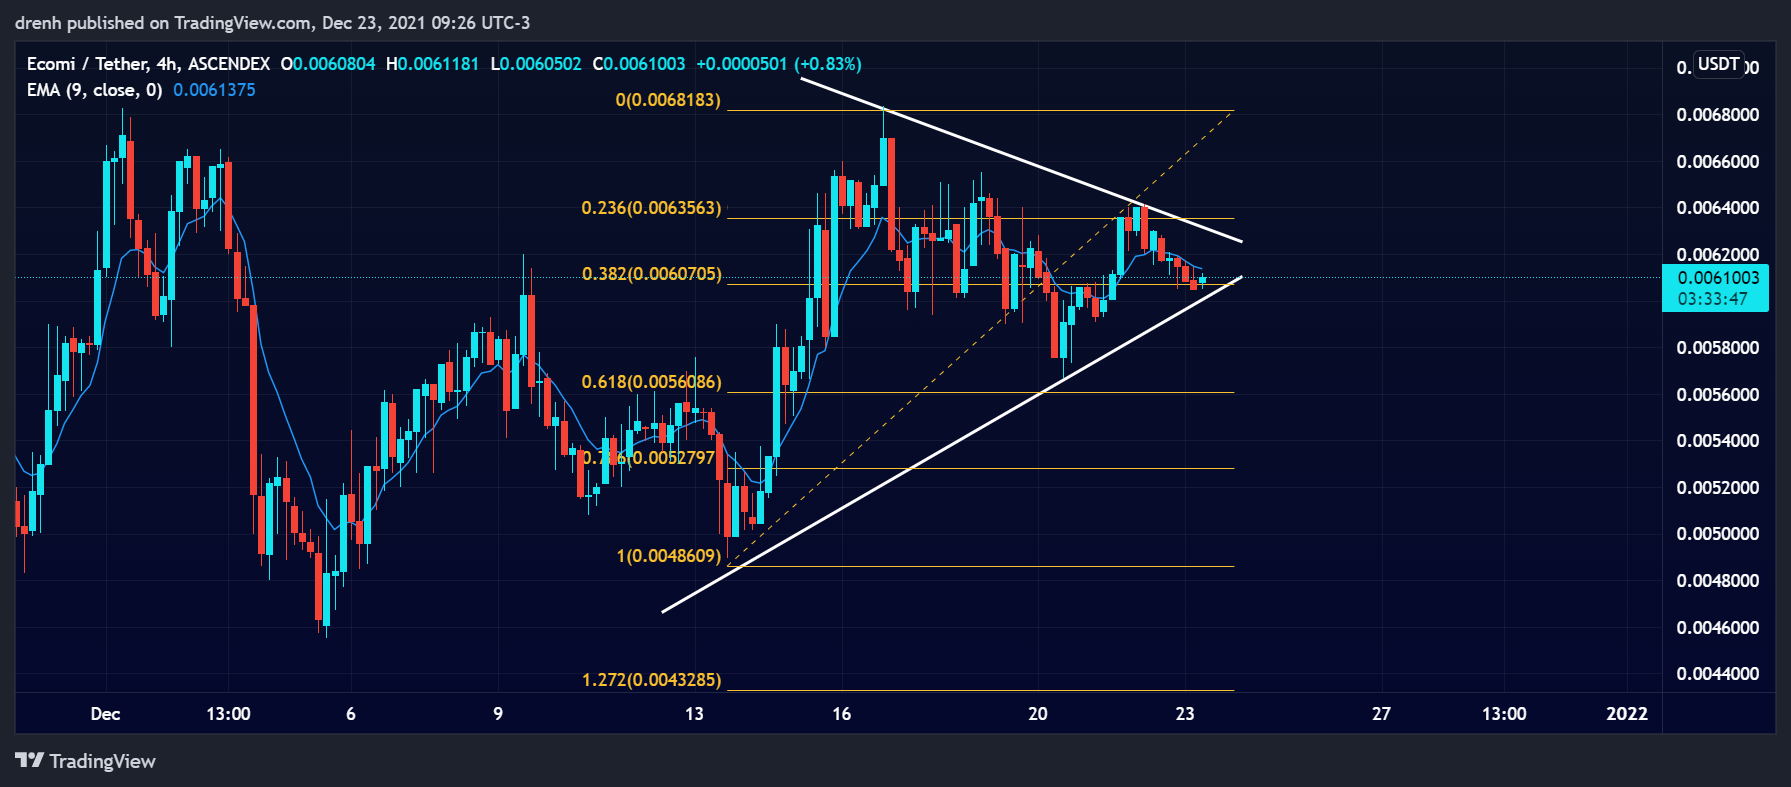
The 9-EMA of a 4-hour chart is also slightly below the price, suggesting that OMI may now be bullish and that the EMA line could act as support to the price.
Relative Strength Index
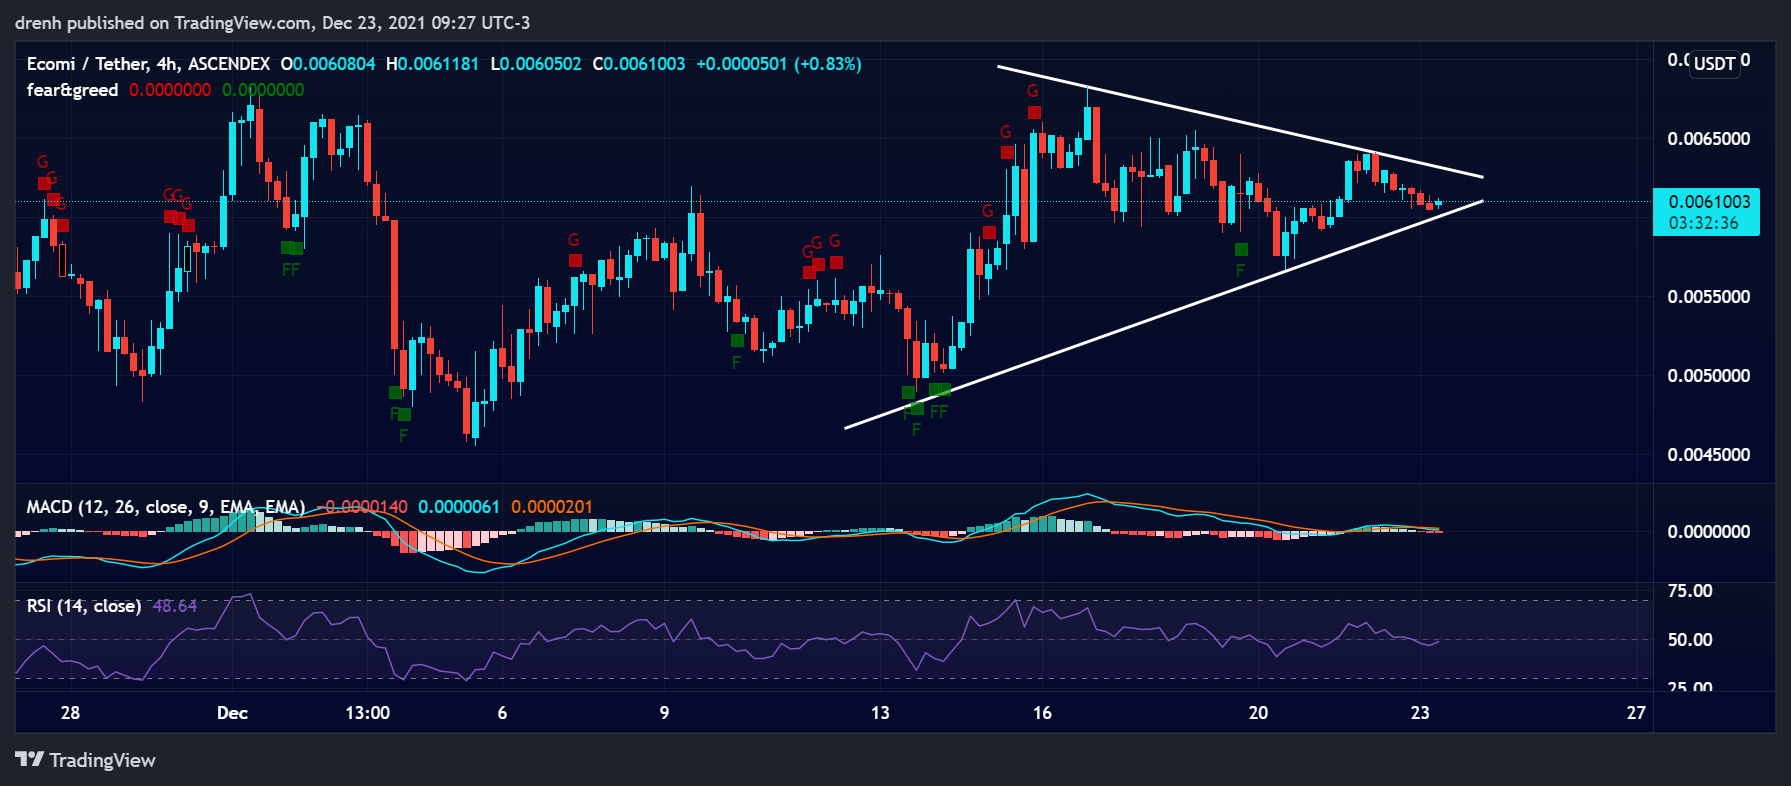
The RSI of a 4-hour chart is well within the 30-70 range and at around 50, indicating that the price of OMI has plenty of room for growth. Since a breakout is predicted to occur, there is plenty of space for OMI to head upward in the short run.
MACD
The MACD line of a 4-hour chart is close to the signal line. Since the lines have converged and the MACD line is above the baseline, the momentum could be bullish for OMI.
Fear & Greed
The fear and greed indicator of a 4-hour chart suggests that the current emotion of OMI traders is fear due to the recent retracement of the price. Nonetheless, fear is often the best to buy, so we could see the bullish breakout be supported by traders’ emotions.

Fibonacci
The Fibonacci retracement levels of a 4-hour chart suggest that the price of OMI has recently retraced to the 61.8% level, indicating that the price could have a surge upward in the short run.
Price Prediction OMI – December 2021
Based on this technical analysis on ECOMI (OMI), we could see the price of OMI have an upward surge in the short run. The price could head close to $0.008 in the coming days as resistance at $0.007 is expected to be broken. With this projected uptrend for OMI, we could see its price reach $0.01 once again in December.
Latest News for OMI – Affecting Price
Recently, ECOMI has been displaying a lot of Christmas-themed NFTs due to the holiday season. This could increase the demand for OMI and further increase its pierce in the coming days.
Inspired by the festive and decorated trees he saw on Terra, Groot made the decision to be this year’s centerpiece of the Guardians’ holiday festivities!
Three premium digital collectibles drop in blind box format Fri, 24 Dec. at 8AM PT.#MARVELxVeVe pic.twitter.com/9OMLCkmCi6
— VeVe | Digital Collectibles (@veve_official) December 22, 2021
Also read:
What is ECOMI (OMI) – Everything you Need to Know About ECOMI Cryptocurrency
How to Buy Ecomi – A Step-by-Step Guide
ECOMI (OMI) Review – Is ECOMI a Good Investment?
ECOMI Price Prediction 2022 and Beyond – Can OMI Reach $1?
ECOMI Price Prediction 2025 – What Will OMI Price be in 2025?
ECOMI Price Prediction 2030 – What Will OMI Price be in 2030?