


DOT Technical Analysis – September 2021
Monthly Analysis
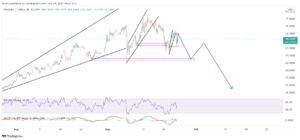
Over the last 30 days, DOT increased by almost 65%. Then, the price was followed by a decrease of 34%. The price of DOT attempted to increase and encountered resistance at $33.6. The trend is downward.

Weekly Analysis
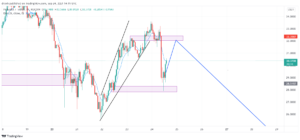
In just the last 7 days, the price of DOT decreased by almost 30%. After that, DOT attempted a correction but was stopped at the projected structure of resistance.
Daily Analysis
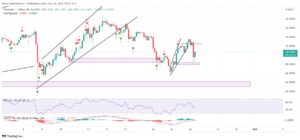
In the intraday chart, DOT has decreased by 17%. It found support at $27.9. Then, the price of DOT increased by 9%. In the coming hours, DOT might increase, but the longer-term price is expected to be bearish.

Key Structures
Support
- $27.9
Resistance
- $32.3
Indicators
Moving Average
The 20-day moving average is currently above the price. This indicates that the trend is now downwards and that the MA line can act as resistance in the coming days.
Due to the recent price decrease, the 9-day EMA is now also above the price and may act as resistance for the price of DOT in the coming days.
Relative Strength Index
The RSI of a daily chart is fairly average at around 50. This suggests that the price is neither bearish nor bullish at the moment, indicating that it has room for growth or to decline. The same can be said about the RSI of a 4-hour chart.
MACD
The MACD line is below the signal line and is now heading below the baseline. This indicates that the momentum in a daily chart is bearish and that the price might keep decreasing in the coming days. However, in a 4-hour chart, the MACD line is still above the signal line, and it might indicate that the price could increase in the coming hours.
Fear & Greed
The fear and greed indicator suggests that the recent emotion for DOT traders was greed. While this might suggest that the price can keep increasing, excessive greed is usually followed by a downward breakout.

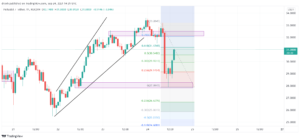
Fibonacci
The Fibonacci retracement levels suggest that the price of DOT can go up in the coming hours and encounter resistance either at the 61.8% or 78.6% levels. After that, the price could aim for one of the Fibonacci extension levels.

Head & Shoulders
In the recent price pattern of DOT, a head-and-shoulders pattern has emerged. If the right shoulder finds resistance at $32.3, then DOT could go below $24 in the coming days or weeks.
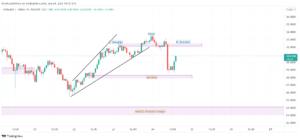

Price Prediction DOT – September 2021
In the coming hours, the price of DOT could increase to $32.3, therefore finding resistance, forming a lower high, and creating a new downtrend. As for the coming days, DOT could also retest support at $27.9, creating a correction pattern at the neckline, while the downtrend continues. The longer-term trend suggests that DOT could decline as low as $24, meeting the first touch of the beginning of the previous ascending wedge, other things equal.
Latest News for DOT – Affecting Price
Recently, Deutsche Boerse has launched ENTs in Solana and Polkadot. This could have a positive impact on the price of DOT in the coming months. Nonetheless, the current trend is downward.
Also read: Polkadot Price Prediction 2021 and Beyond – Is DOT a Good Investment?