


ELON Technical Analysis – December 2021
Monthly Analysis
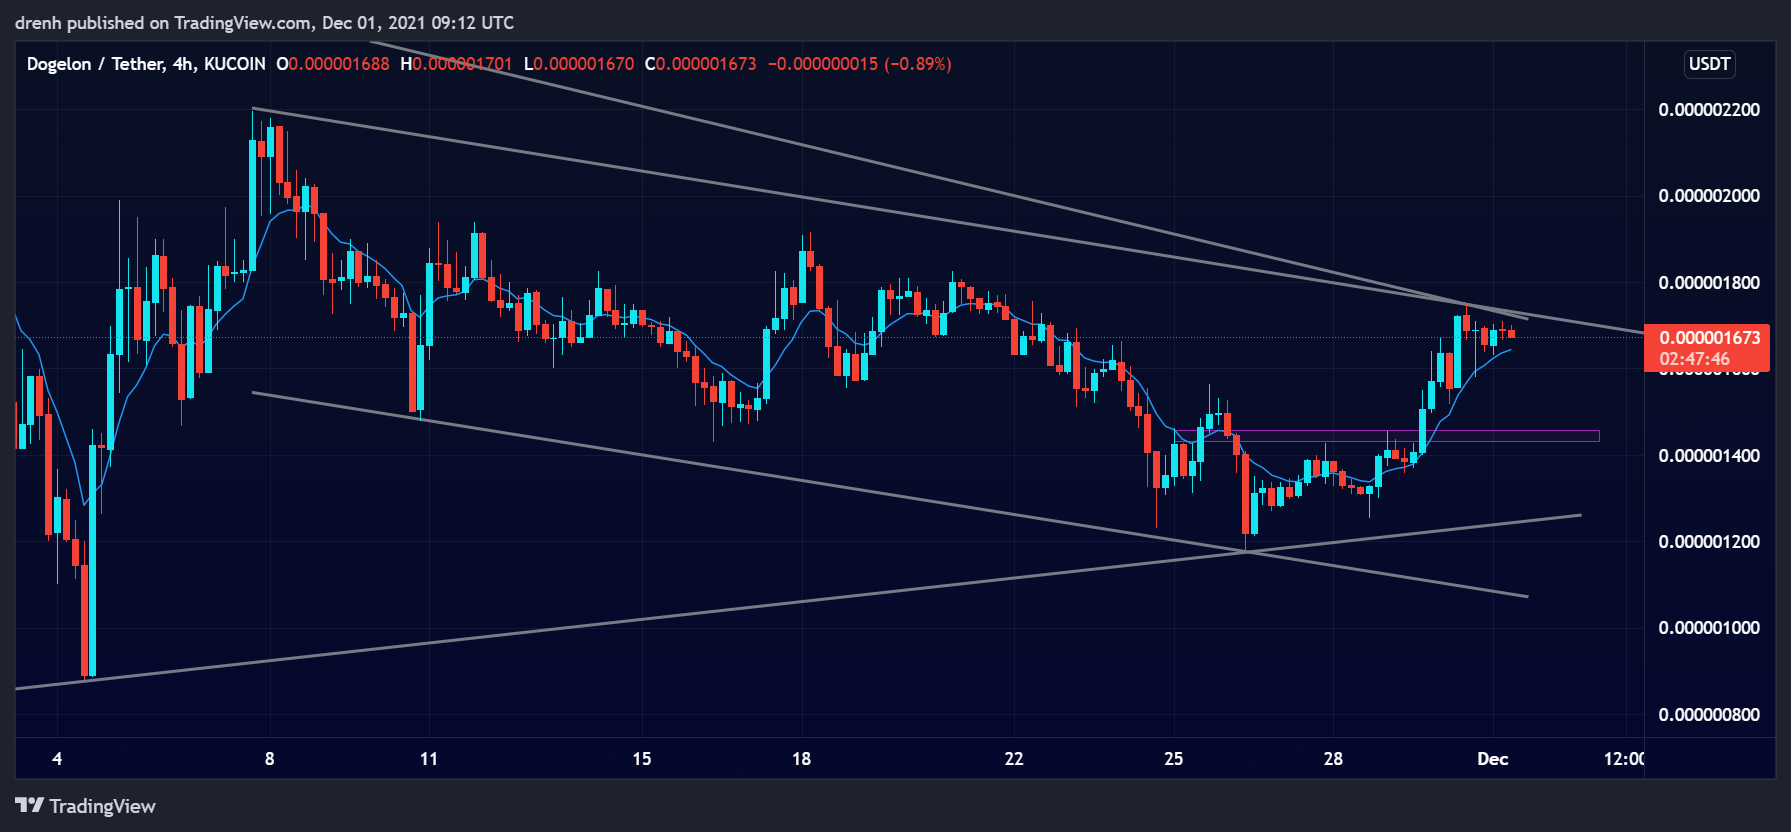
After declining by around 67% in the first few days of November, Dogelon Mars had an increase of 147%. This increase was stopped from resistance at $0.0000022. After that, the price of ELON has been in a downtrend in the 4-hour chart. Recently, the price has started increasing again, and the price may soon reverse the trend. Furthermore, the price has created a triangle pattern in the longer run, meaning that a breakout could occur soon for ELON.

Weekly Analysis
In the last 7 days, ELON has been bullish. The price has increased by around 48%, indicating that the trend may now be reversed as the new highs and lows are higher than the previous ones. The price is currently facing resistance at $0.0000017.
Daily Analysis
In the intraday chart, ELON has been quite volatile. The price has been in consolidation in the intraday chart, as ELON has increased or decreased by 2-4% continuously in the last few hours. An ascending triangle pattern could be noticed in the intraday chart, meaning that a bullish breakout could occur soon.
Key Structures
Support
- $0.0000019
Resistance
- $0.0000012
Indicators
Moving Average
The 20-moving average in a 4-hour chart is quite below the price of ELON, indicating that the trend is now upward and that the price of ELON could increase in the coming days of this month.
The 9-EMA of a 4-hour chart is also below the price, meaning that ELON could keep increasing and that the EMA line could act as support to potential price dips of Dogelon Mars.
Relative Strength Index
The RSI of a 4-hour chart has approached 70 recently, meaning that ELON may soon become overbought if the price keeps increasing at this rate. However, since ELON is currently facing resistance, we could see the price retrace in order for ELON to continue its run upwards.
MACD
The MACD line of a 4-hour chart is currently above the signal line, indicating that the momentum is bullish for ELON and that the price can naturally keep increasing. However, the lines have started converging recently, indicating a retracement or even a shift in momentum.
Fear & Greed
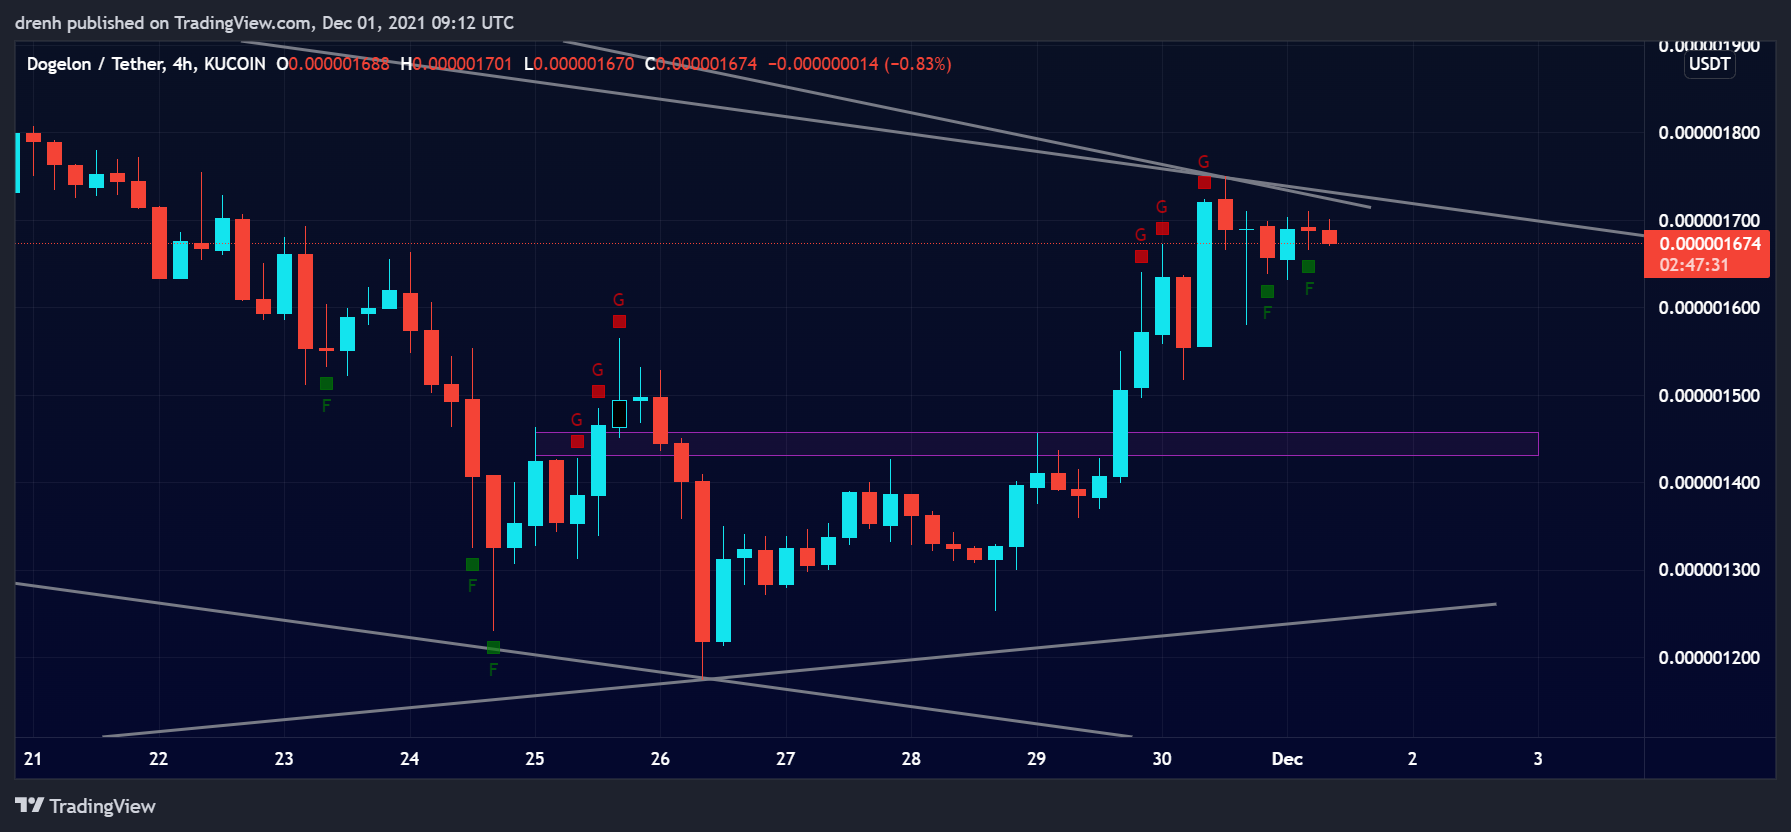
The fear and greed indicator of a 4-hour chart suggests that the current emotion of ELON traders is fear since the attempt to break resistance at $0.0000019 failed. However, this could easily turn into greed once again as ELON has shown bullish tendencies in its recent price movement of a 4-hour chart.
Fibonacci
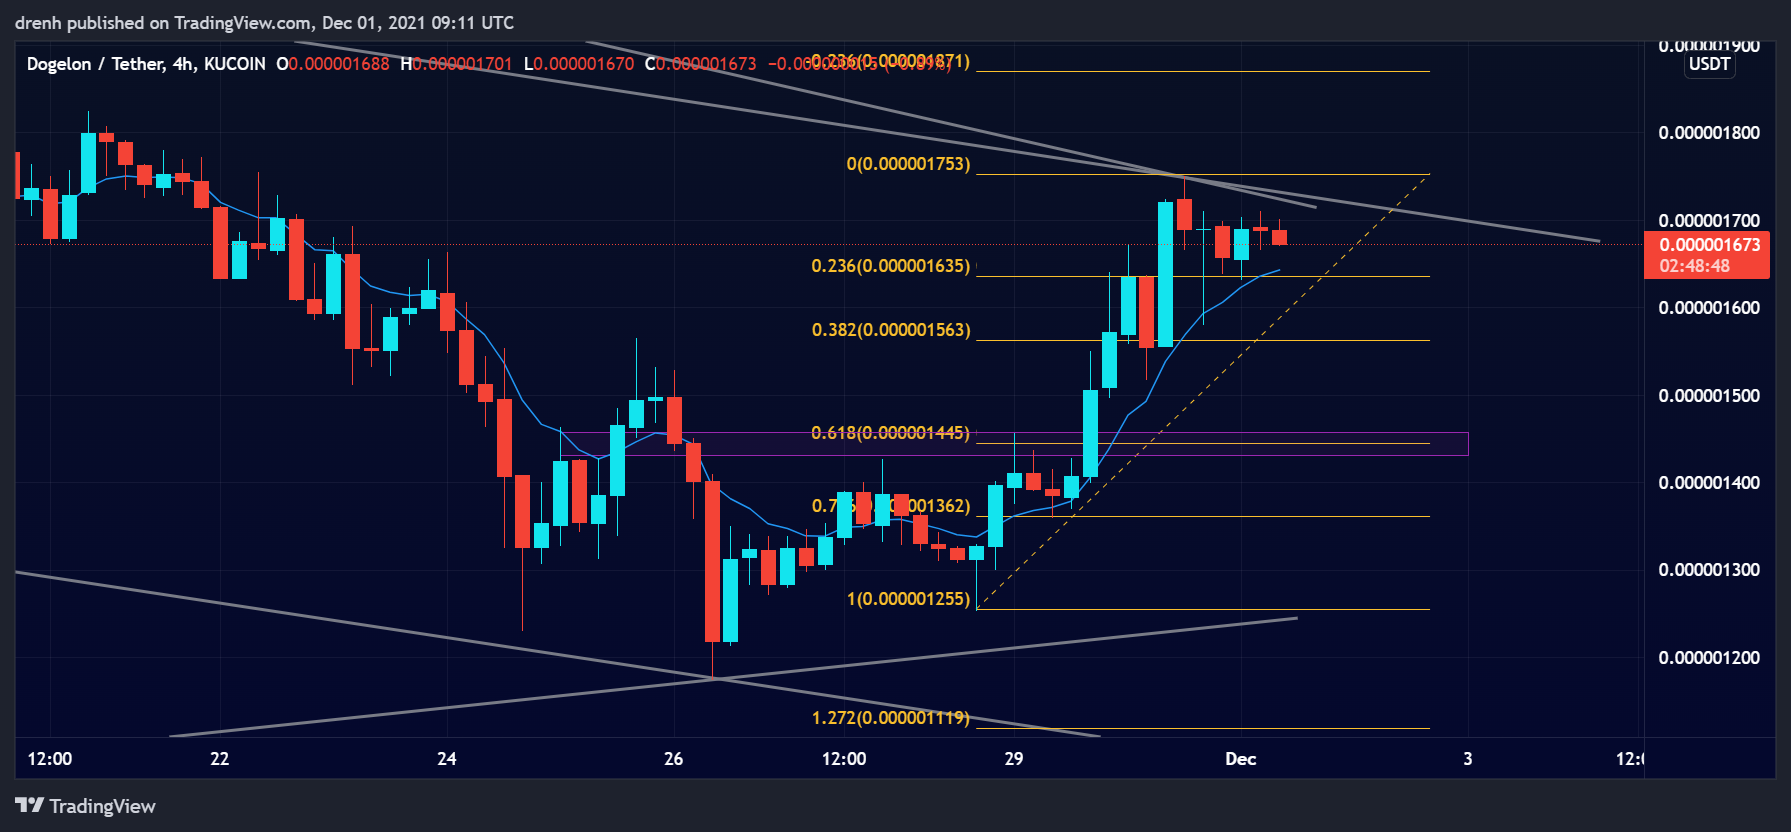
The Fibonacci retracement levels suggest that if the price of ELON retraces in the short run, we could see the 61.8% Fibonacci level turn out to be a strong level of support. That zone also coincides with previous structures.
Price Prediction ELON – December 2021
Based on this technical analysis on Dogelon Mars, we could see its price retrace in the coming hours close to $0.0000014. If it finds support there, we could see ELON surge upwards and surpass $0.000002. This would put ELON in the top 100 rankings once again. By the end of December, we could see ELON reach closer to $0.000004.
Latest News for ELON – Affecting Price
Dogelon Mars had recently launched the xELON token, which aims to provide the best DeFi services in the market. WIth DeFi becoming more important to traders, this could only increase the exposure and the demand for ELON, consequently increasing the price of ELON in the longer run.
Also read: Dogelon Mars (ELON) Price Prediction 2022 and Beyond – Can ELON Eventually Hit $1?