


DOGE Technical Analysis – December 2021
Monthly Analysis
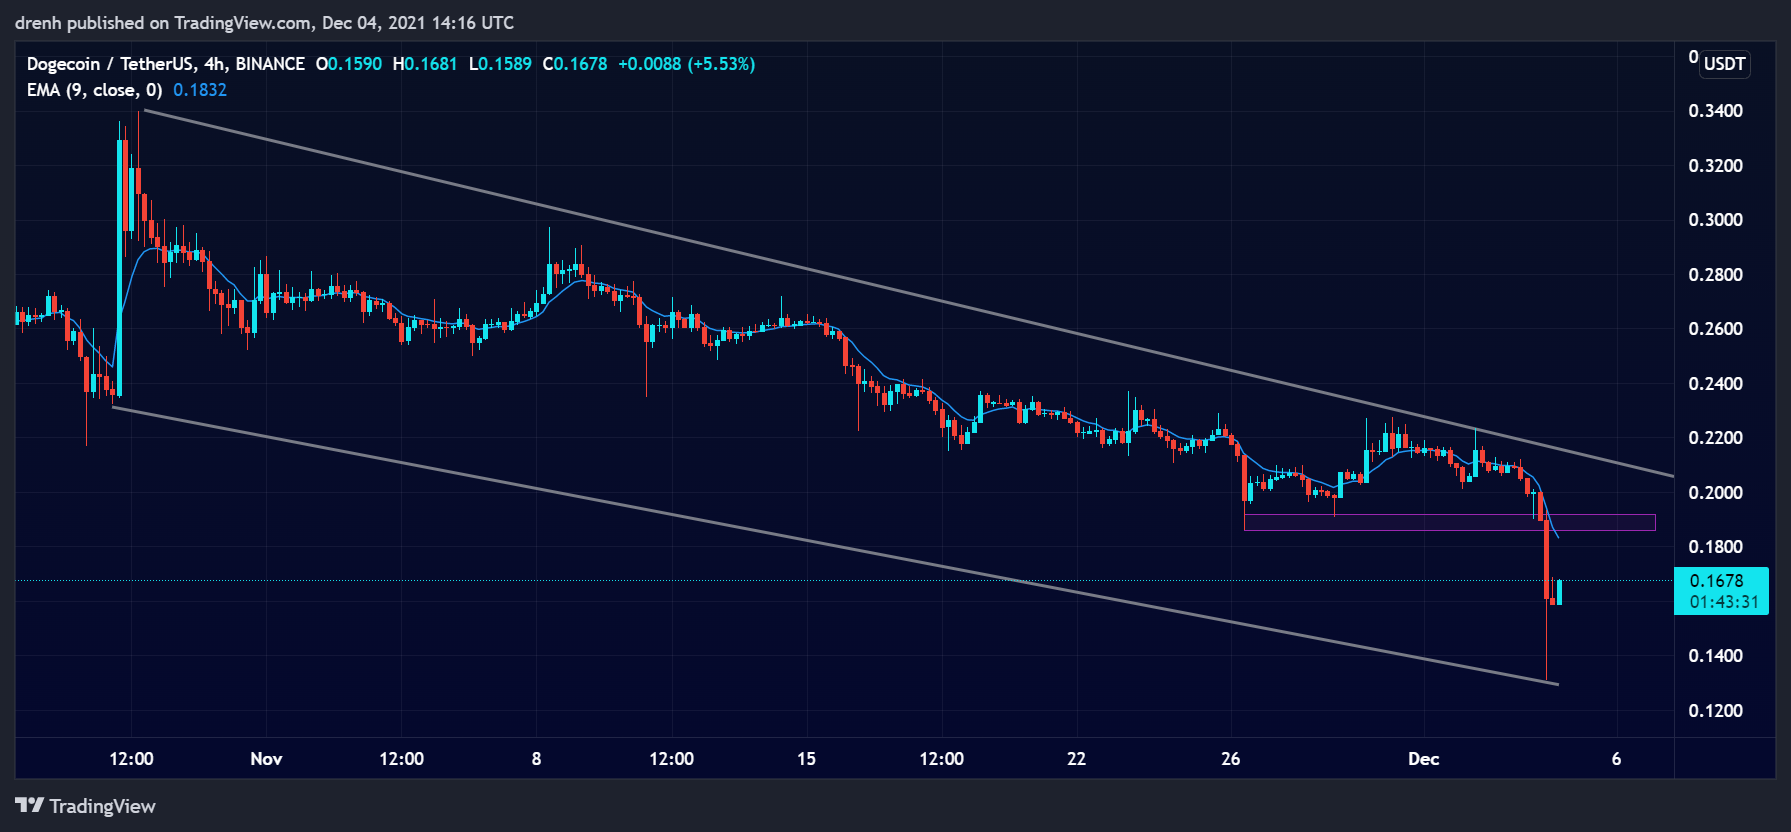
Over the last 30 days, DOGE has been in a bearish run. The price has declined by around 56%. After the price found support at around $0.19, the price was in consolidation. But, the price had yet another bearish surge after that, dropping the price as low as $0.13. It is currently attempting a correction, but the overall trend remains downward for Dogecoin.

Weekly Analysis
In the last 7 days, the price initially increased by around 20%. However, after facing resistance at $0.22, the price then was followed by a drop of 41%. The trend remains bullish as sellers are still dominant in the DOGE trades.
Daily Analysis
In the intraday chart, the price initially declined by 33%. After that, it increased by around 36%, suggesting that DOGE is now in correction. DOGE is slightly bullish in the shorter run, but it is still bearish in the 4-hour chart.
Key Structures
Support
- $0.13
Resistance
- $0.19
Indicators
Moving Average
The 20-moving average of a 4-hour cart is above the price, indicating that the current trend is downward and that the price of DOGE could keep declining in the coming days.
The 9-EMA of a 4-hour chart is also above the price despite the recent upward impulse, indicating that DOGE is bearish in the short run and that the EMA line could act as resistance if the price attempts to further increase.
Relative Strength Index
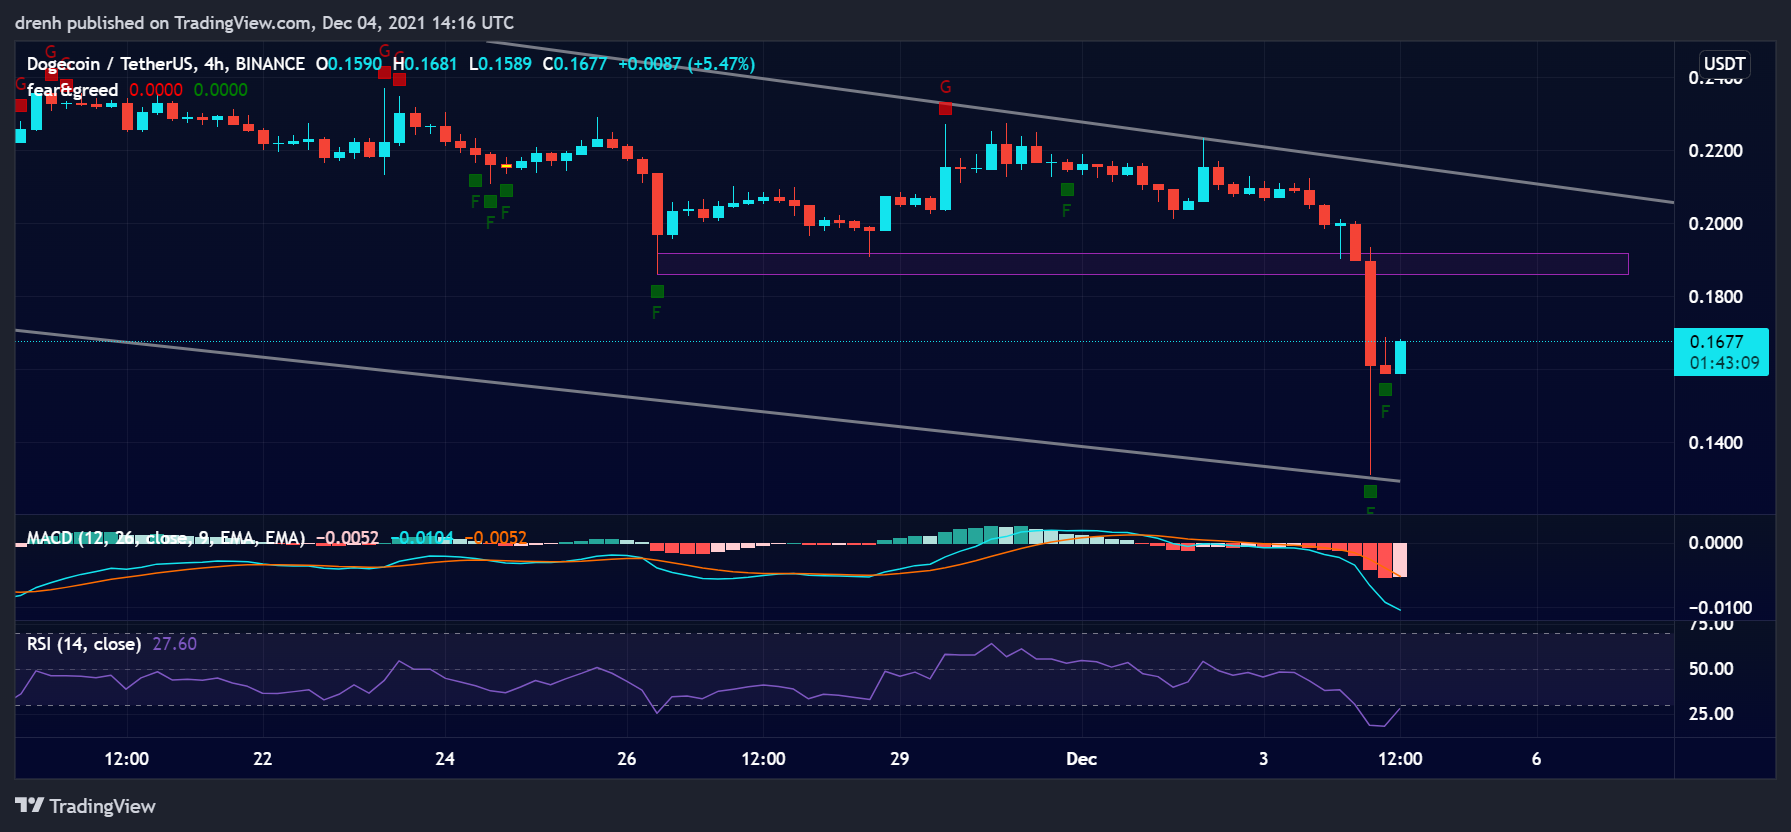
The RSI of a 4-hour chart was recently below 30, meaning that DOGE became oversold. Therefore, the recent upward impulse was expected. The RSI now is within the 30-70 range, but it is still bearish.
MACD
The MACD line of a 4-hour chart is quite below the signal line, indicating that the momentum is bearish for Dogecoin and that the price could keep declining in the short run.
Fear & Greed
The fear and greed indicator of a 4-hour chart suggests that the current emotion of DOGE traders is fear due to the recent bearish breakout.
Fibonacci
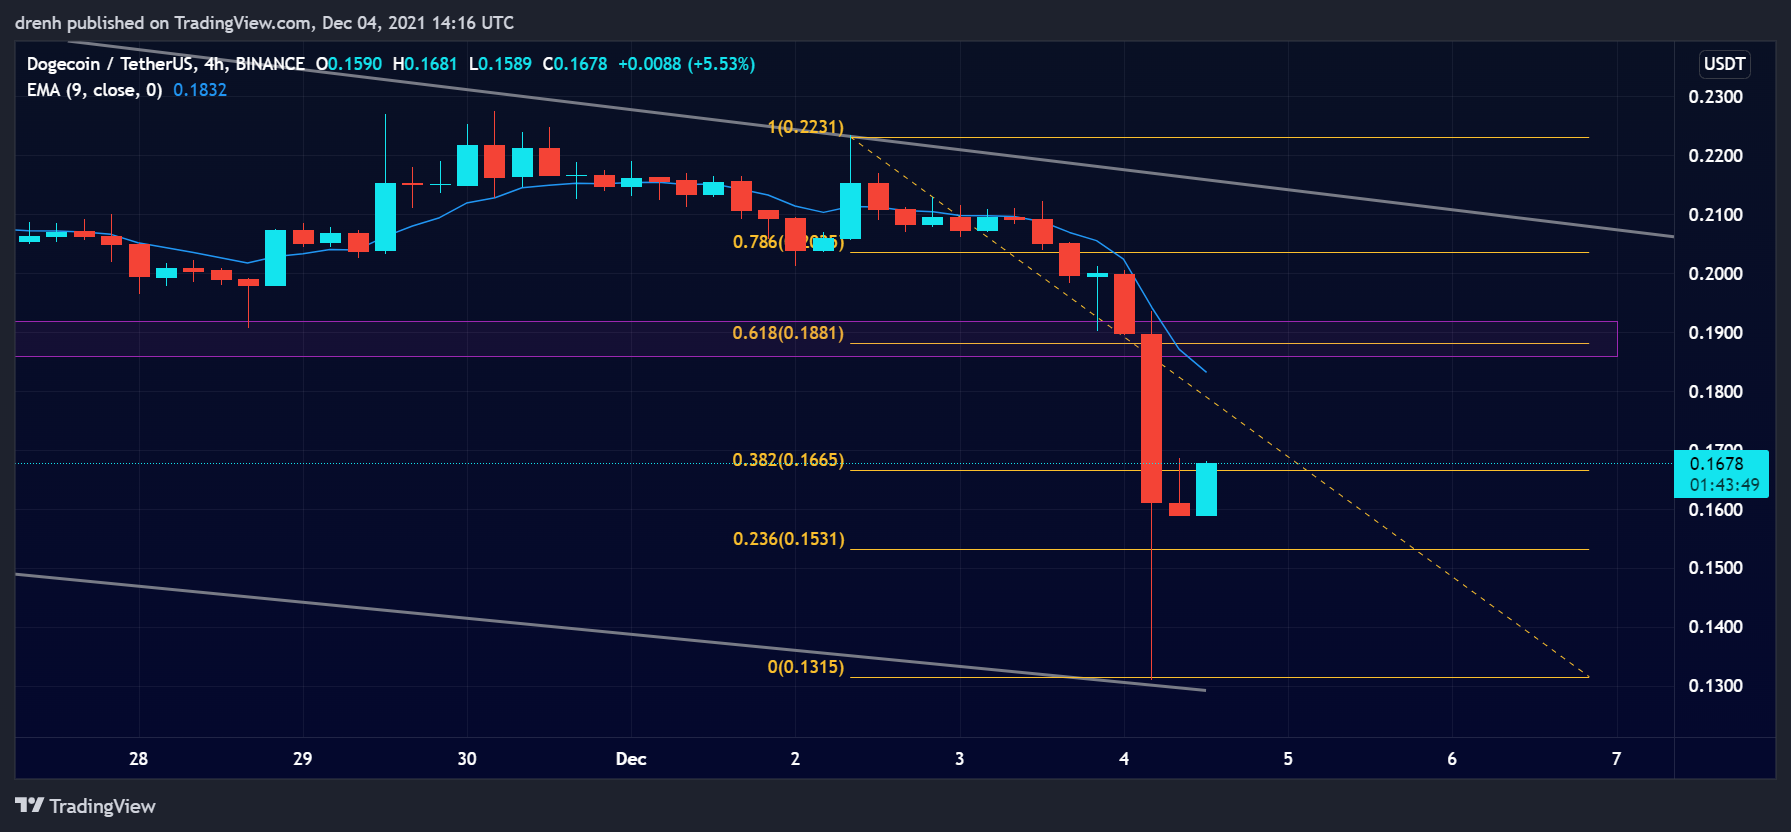
The Fibonacci retracement levels of a 40hour chart suggest that the price of DOGE could increase in the short run to the 61.8% level as it also coincides with previous support structures. If that happens, then we could see DOGE face resistance in that area.
Price Prediction DOGE – December 2021
Based on this technical analysis of Dogecoin (DOGE), we could see its price increase up to $0.19 in the short run. If it fails to beat resistance there, then we could see DOGE go below $0.10 in the coming days. However, resistance is broken and the bullish run of 2021 has one final leg, we could see DOGE go to $0.35 by the end of this month. In the longer run, DOGE has the potential to reach $1, other things equal.
Latest News for DOGE – Affecting Price
Recently, Elon Musk has reaffirmed his advocacy for Dogecoin (DOGE) in his social media activity. This statement came after people were complaining about the high DEX fees on Ethereum. Elon’s stance is still one of the biggest factors of Dogecoin’s success. Hence, his tweets can still greatly boost the price of DOGE.
Also read:
Dogecoin Price Prediction 2022 – What Will the Dogecoin Price be in 2022 and in Next Years to Come?
Will Dogecoin Go Up Again? – How High Could DOGE Price Go?
Dogecoin Price Forecast – Will DOGE Reach $1 in 2021?
How High Can Dogecoin Go? – Dogecoin Price Prediction
How to Mine Dogecoin (DOGE)? – The Definitive Guide 2021