


MANA Technical Analysis – October 2021
Monthly Analysis
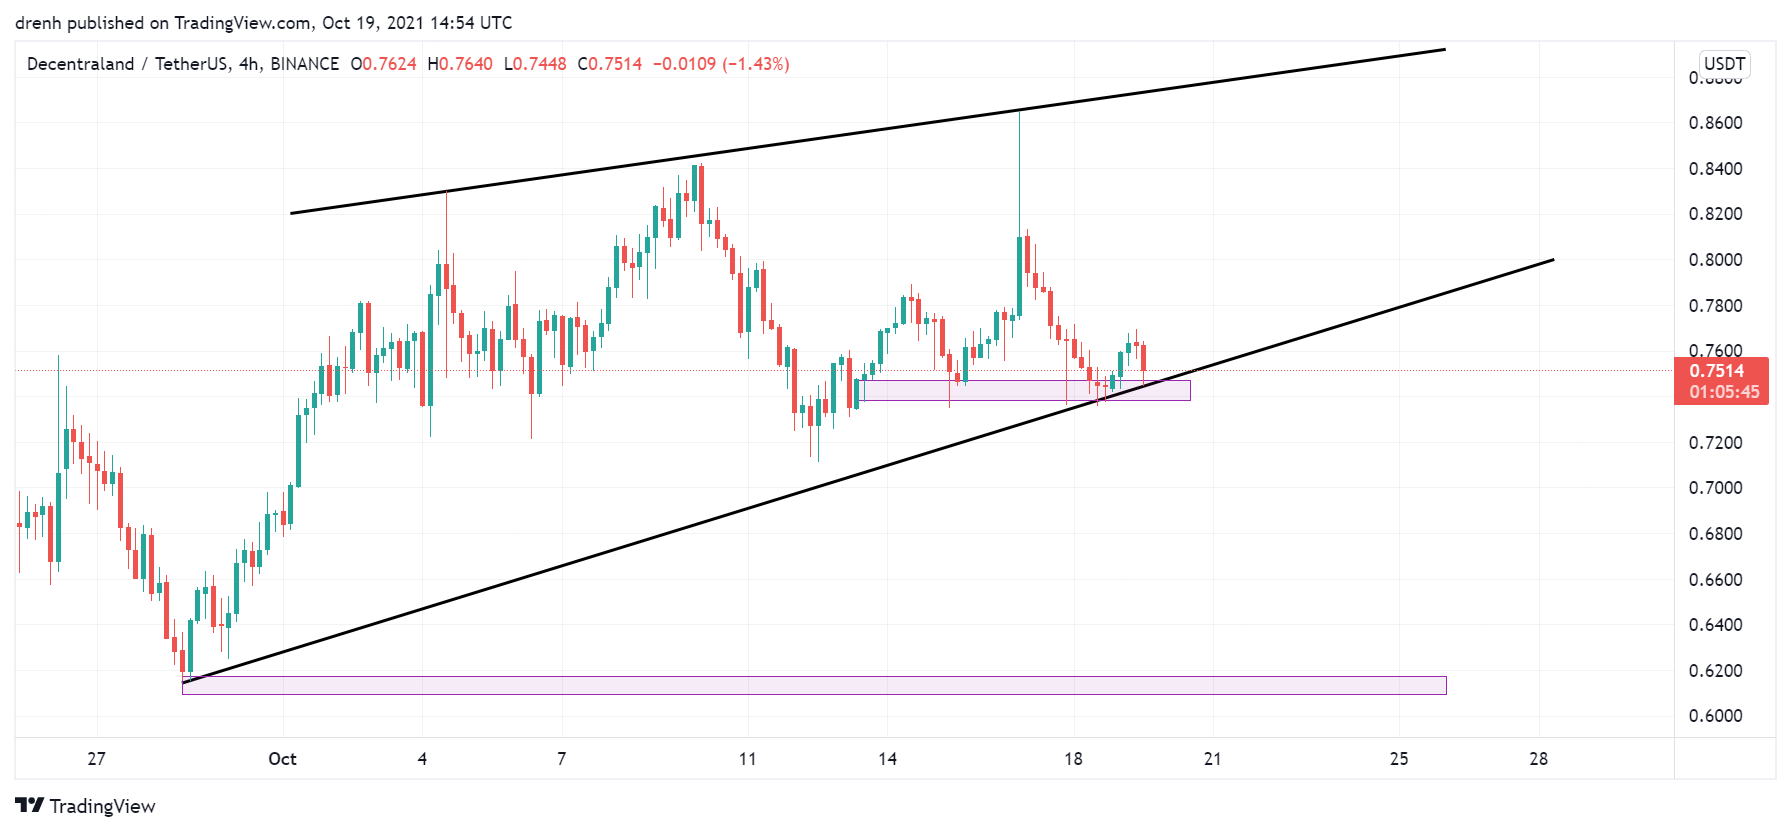
Over the last 30 days, MANA initially decreased by 28%. After that, the price found support at around $0.60. The price attempted to correct after that, but it dropped back to that region. Then, the price of MANA started increasing. After increasing by around 40%, MANA hit resistance at $0.86. A head-and-shoulders pattern could be noticed in the recent price movement.

Weekly Analysis
In the last 7 days, MANA increased by around 21%. After that, the price started decreasing again, and it has decreased by 15% so far. The price is attempting to correct, but the new lows and highs are lower than the previous ones, indicating a reversal.
Daily Analysis
In the intraday chart, MANA has been bullish, where an increase of 3% can be noticed. Nonetheless, the price has declined in recent hours, meaning that the shorter-term price is bearish for MANA.
Key Structures
Support
- $0.72
Resistance
- $0.85
Indicators
Moving Average
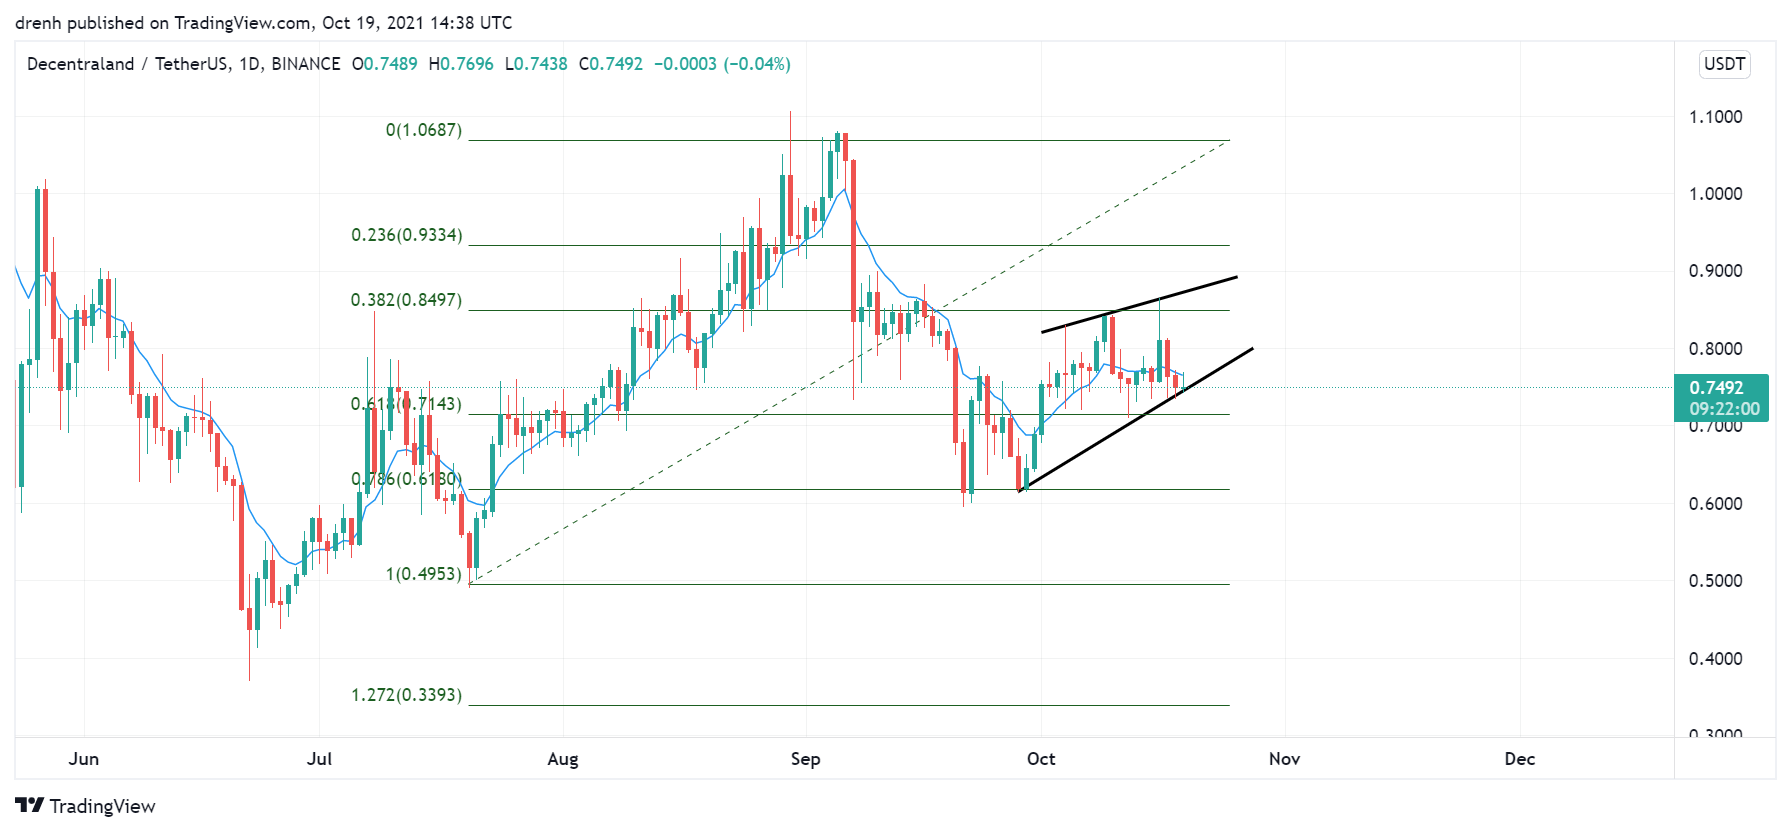
The 20-day moving average has recently moved above the price. This means that the trend might have reversed and that the price of MANA could decrease in the coming days.
The 9-day EMA has also recently moved above the price and is currently acting as resistance to MANA. This could see the price of MANA keep declining in the short run.
Relative Strength Index
The RSI of a daily chart has been fairly average, meaning that the price has plenty of room for both increasing or decreasing. As for the 4-hour chart, the RSI has recently started declining and heading toward the oversold region.
MACD
The MACD line has been above the signal line in the daily chart, indicating that the momentum is bullish. However, the lines have recently converged and are now about to intersect, meaning that the momentum is changing. In a 4-hour chart, the MACD line is already below the signal line, meaning that the momentum is bearish in the shorter run.
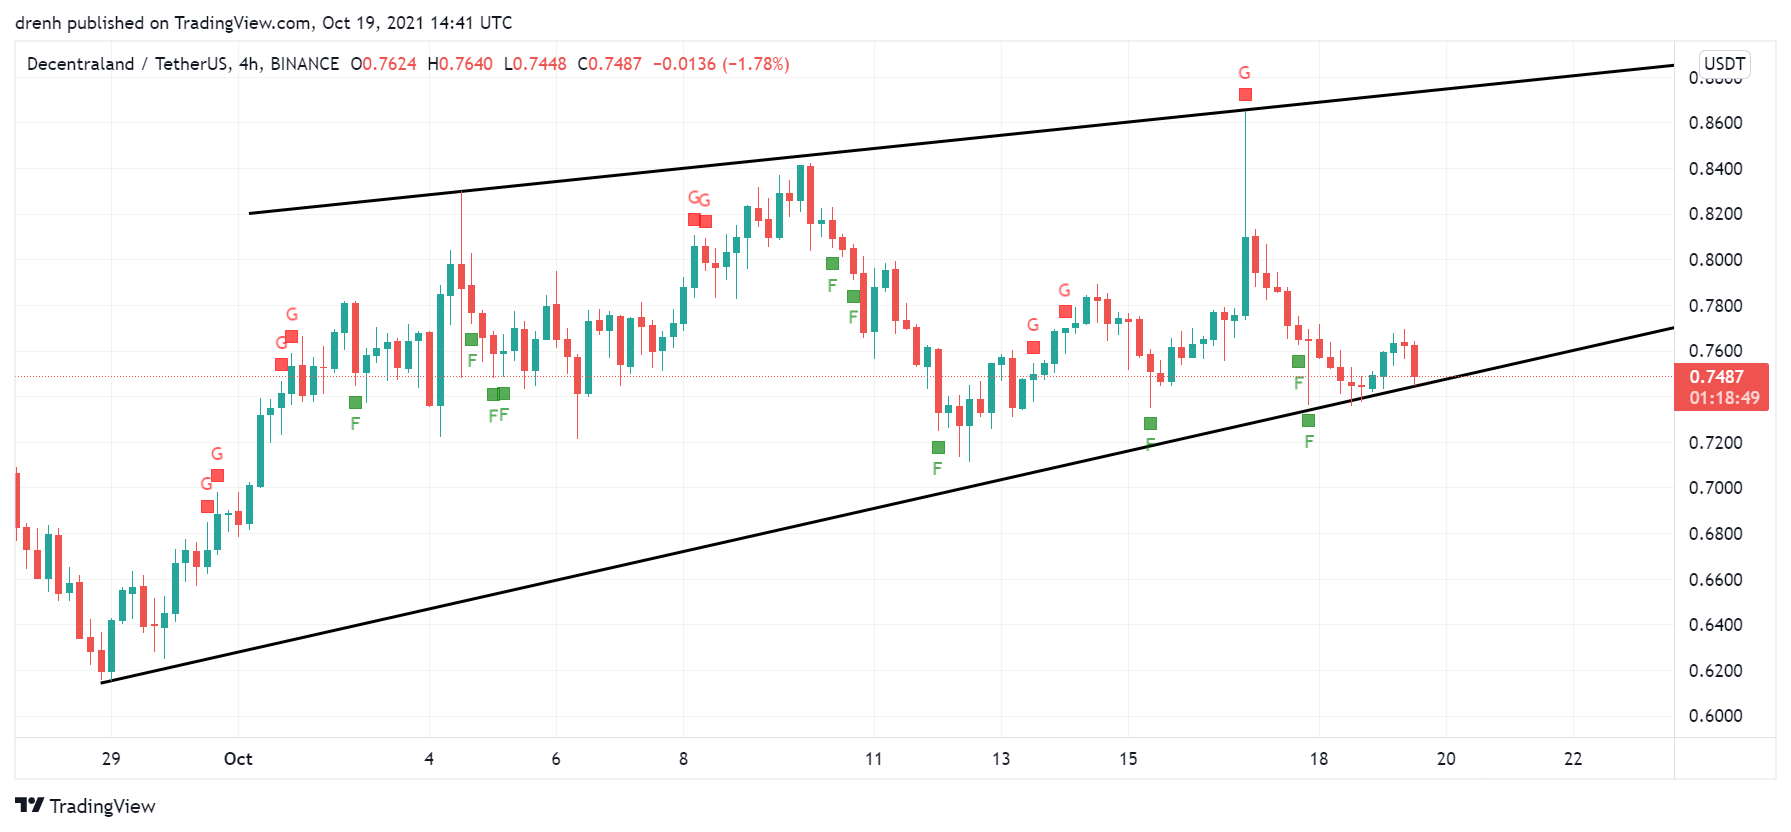
Fear & Greed
The fear and greed indicator in a 4-hour chart suggests that the current emotion of MANA traders is fear, meaning that traders are bearish.
Fibonacci
The Fibonacci retracement level in the longer-term forecasts that the price of MANA has found support at the 78.6% level. This could see the price of MANA increase in the coming weeks.
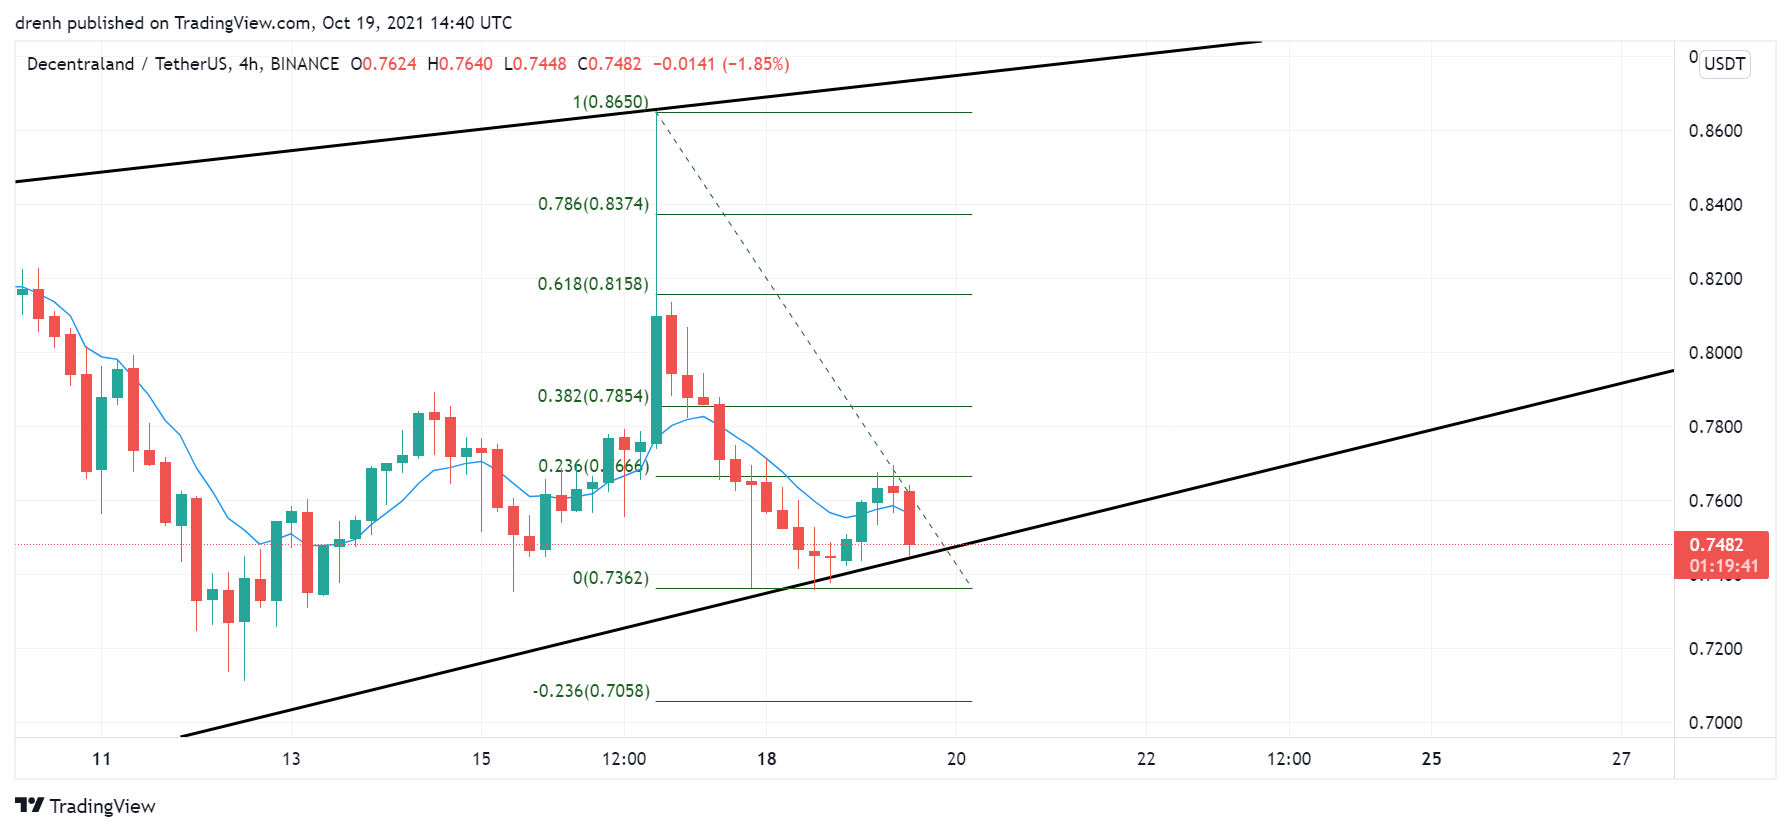
As for the shorter run, MANA has retraced back to the 23.6% level in a 4-hour chart, considering that MANA is in a downtrend.
Price Prediction MANA – October 2021
Based on this technical analysis on MANA, its price could decrease in the short run. If the neckline of the head and shoulders pattern is broken, then MANA could go as low as $0.60 in the coming days. However, MANA is still bullish in the long run as the channel is shaped as an ascending wedge. This could see MANA increase in the coming weeks. If BTC keeps its momentum and increases at larger rates, then a price of $2 is attainable for MANA.
Latest News for MANA – Affecting Price
Recently, it was announced that Paris Hilton is going to be at the Metaverse festival in the Decentraland ecosystem. Such events can greatly boost the demand for MANA tokens as NFTs are increasing in popularity. This can have a positive effect on the price of MANA in the coming weeks.
Also read: Decentraland Price Prediction 2021 and Beyond – Is MANA a Good Investment?