


MANA Technical Analysis – November 2021
Monthly Analysis
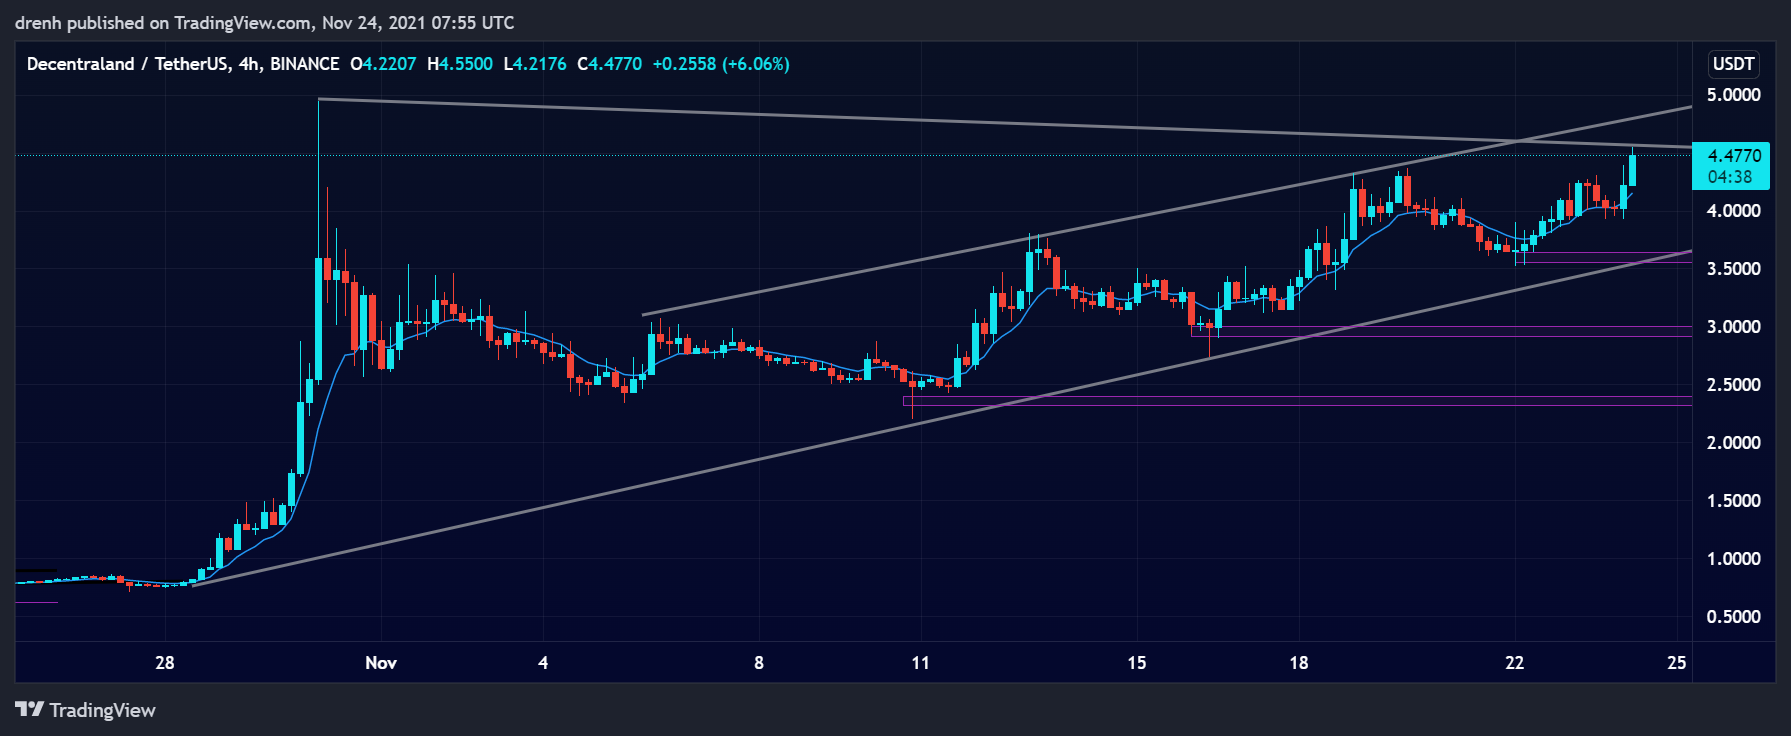
MANA had one of the biggest runs in the market over the last 30 days. The price increased by more than 550% in a matter of just two days. Due to this bullish surge, MANA reached an all-time high at $4.94, making it a historical achievement for the MANA community. After that, the price retraced by 52%, but the trend is still upward. An ascending triangle pattern has taken shape, indicating that another bullish breakout may occur soon.

Weekly Analysis
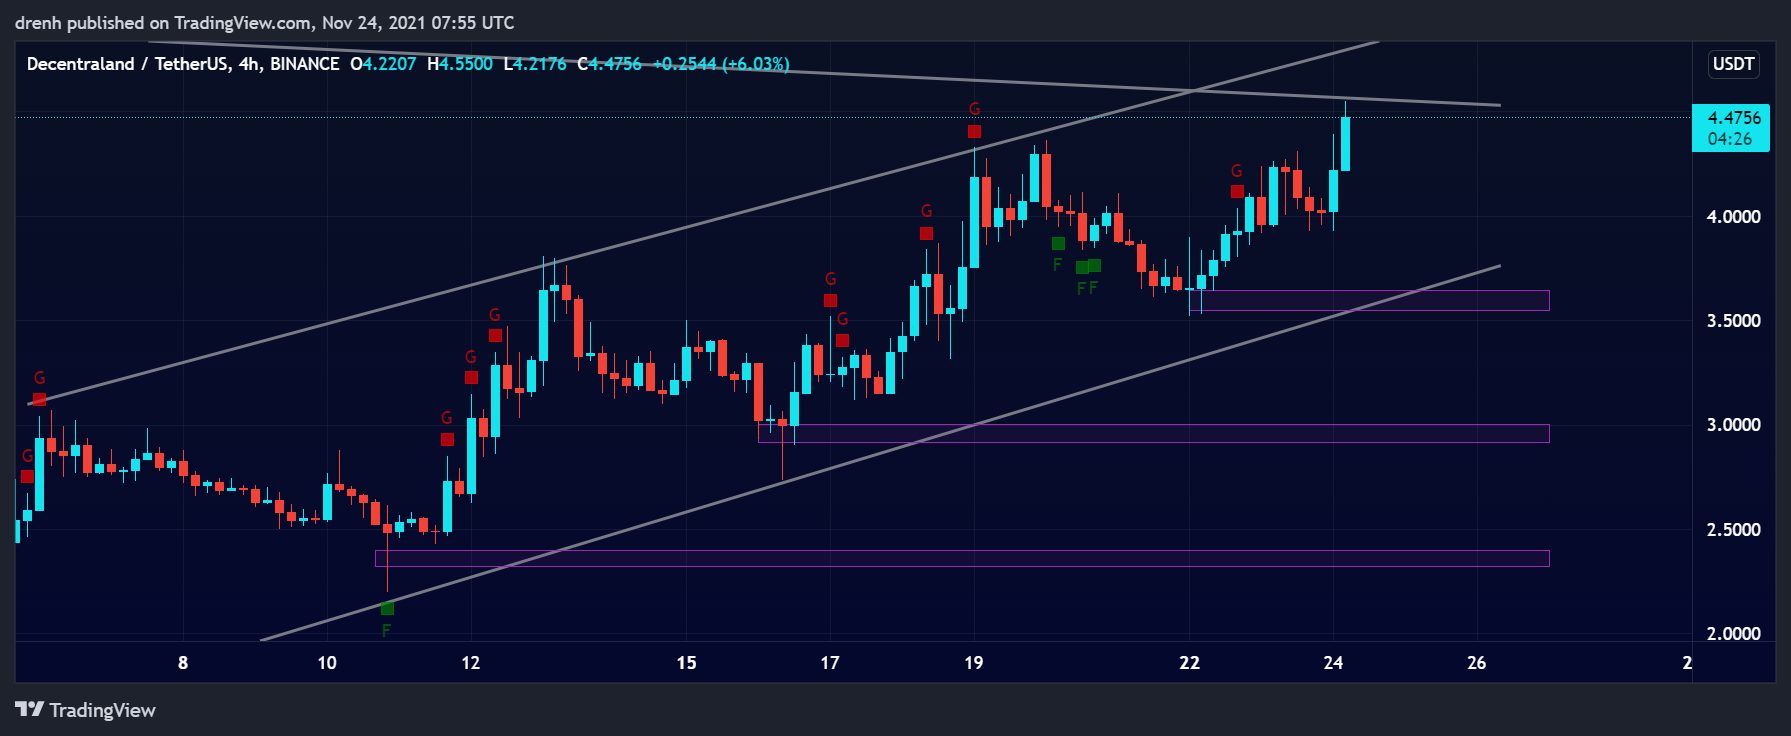
In the last 7 days, the price of MANA has been growing at a steady pace. So far, the price has increased by around 67%, making it a solid uptrend as the price continues to be bullish. In the short run, the price of MANA could keep this pace and retest resistance at the all-time high.
Daily Analysis
MANA has been quite bullish in the intraday chart as well. The price has increased by around 16% in the last few hours, with a couple of retracements along the way. The price could keep increasing in the coming hours as the bullish momentum continues.
Key Structures
Support
- $3.55
Resistance
- $4.94
Indicators
Moving Average
The 20-moving average of a 4-hour chart is below the price, indicating that the trend is upward and that the price of MANA could keep increasing in the coming days.
The 9-EMA of a 4-hour chart is also below the price, indicating bullish tendencies for MANA. The EMA line could act as support if the price attempts another retracement in the short run.
Relative Strength Index
The RSI of a 4-hour chart is close to 70, meaning that MANA is almost overbought. Because of this, we could see the price of MANA retrace before it continues its journey upwards.
MACD
The MACD line of a 4-hour chart is above the signal line and above the baseline, indicating that the momentum is bullish and that the price of MANA could keep increasing in the short run.
Fear & Greed
The fear and greed indicator of a 4-hour chart suggests that the current emotion of MANA traders is greed due to the recent upward movement. The only aspect of fear in MANA is the fear of missing out (FOMO).
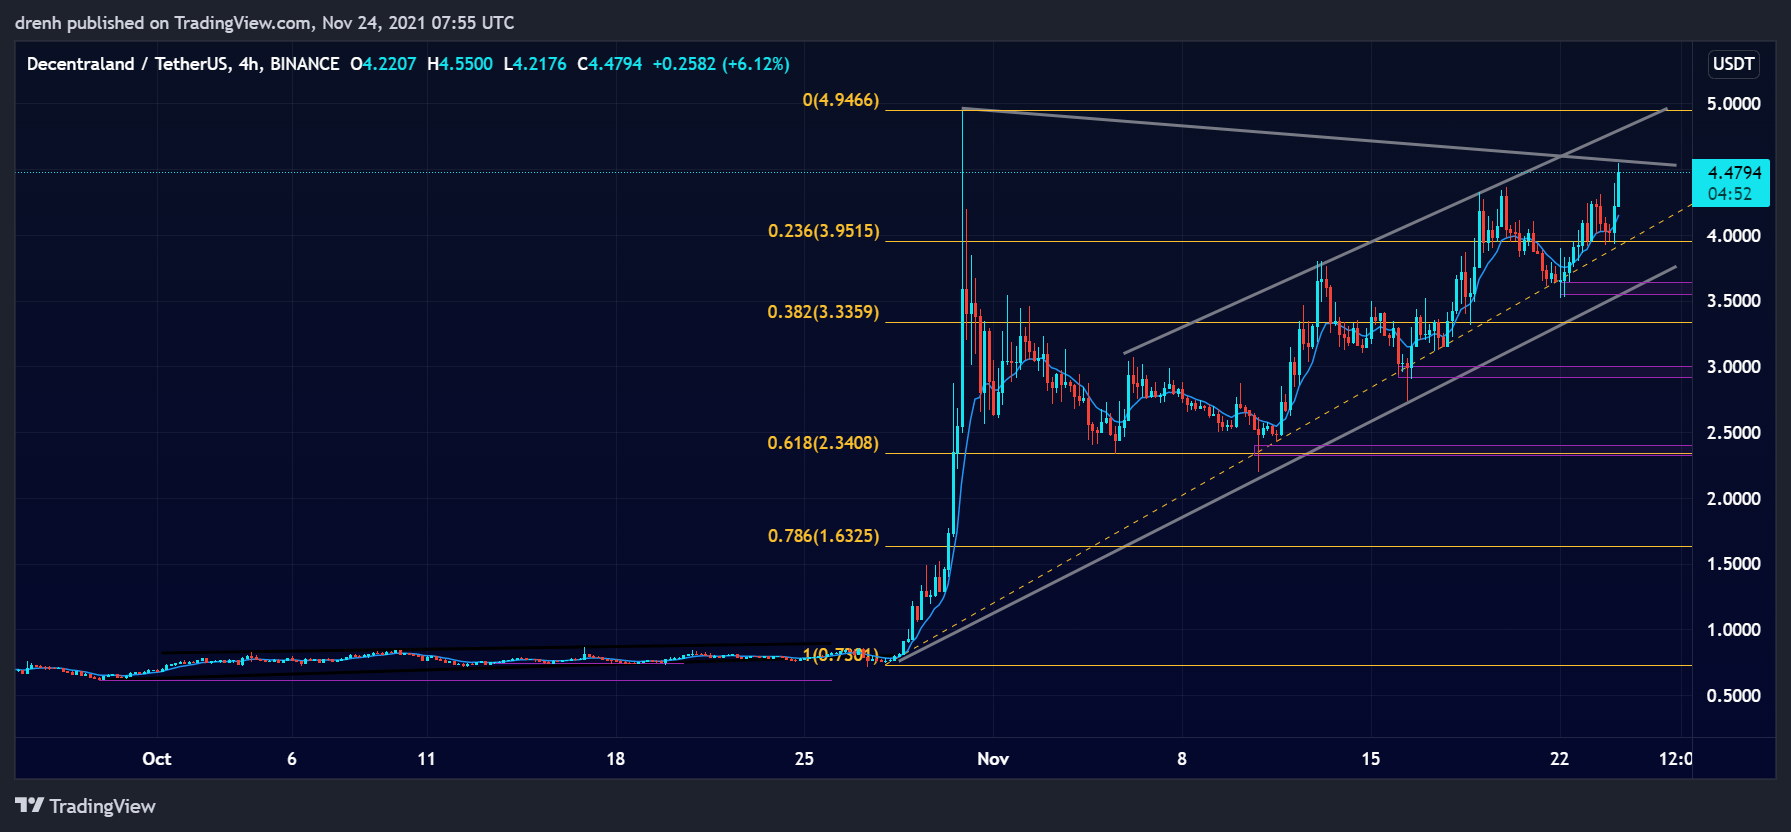
Fibonacci
The Fibonacci retracement levels suggest that the price of MANA had retraced to the 61.8% level after the historical bullish surge of 550%. This retracement hinted at the possibility of MANA going even further. The price could aim for one of the extension levels in the coming days.

Price Prediction MANA – November 2021
Based on this technical analysis on Decentraland (MANA), we could see its price retrace by less than 20% in the coming hours. After that, once the RSI and other indicators are stabilized, MANA could continue going upward. The price could soon retest resistance at the all-time high, and if broken, MANA could easily surpass $6. In the longer run, MANA could go as high as $10 in this cycle.
Latest News for MANA – Affecting Price
Recently, Canadian firm Tokens.com has purchased $2.5 million worth of virtual real estate in the Decentraland Metaverse. The virtual real estate is around 6,000 acres in size within the Metaverse. Such acquisitions can easily boost the price of MANA as the Metaverse becomes more important to our everyday lives.
Also read: Decentraland Price Prediction 2021 and Beyond – Is MANA a Good Investment?