


COTI Technical Analysis – December 2021
Monthly Analysis
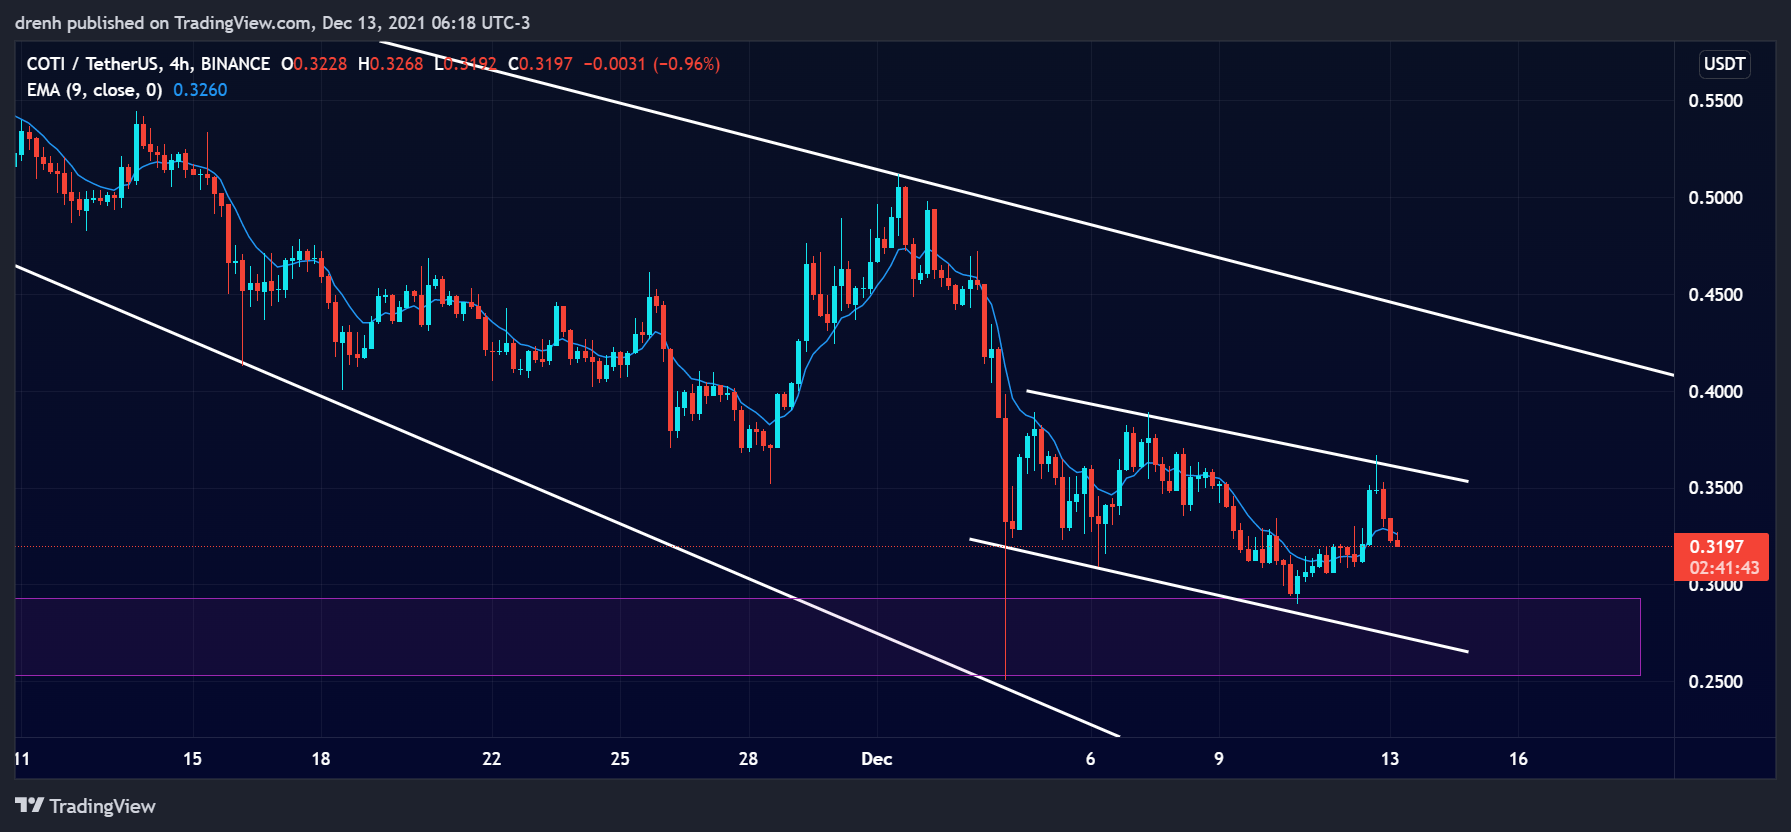
In the last 30 days, COTI initially declined by 36%, but it then had another surge of 46% upwards. Nonetheless, after hitting resistance at $0.51, the price had a bearish breakout of around 50%, suggesting that the downtrend may continue for COTI. After that, the price has been in correction, and it recently failed to break resistance at $0.36.

Weekly Analysis
After increasing by 27%, the price then declined by around 25% in the last 7 days. The price found support at $0.29, and it then had another impulse wave upward by 26%. The new high is lower than the previous one, suggesting that if COTI does not find support soon, the downtrend may continue.
Daily Analysis
In the intraday chart, COTI has been quite bearish. It has declined by around 13% in the last 24 hours, suggesting that the price of COTI could keep declining in the coming hours. The price could soon find support at $0.31 in the intraday chart.
Key Structures
Support
- $0.29
Resistance
- $0.36
Indicators
Moving Average
The 20-moving average of a 4-hour chart is currently above the price, indicating that the trend for COTI is currently downward and that the price could keep declining in the coming days, other things equal.
The 9-EMA is also slightly above the price, suggesting that COTI is bearish in the short run and that the EMA line could act as a resistance structure if the price attempts a correction.
Relative Strength Index
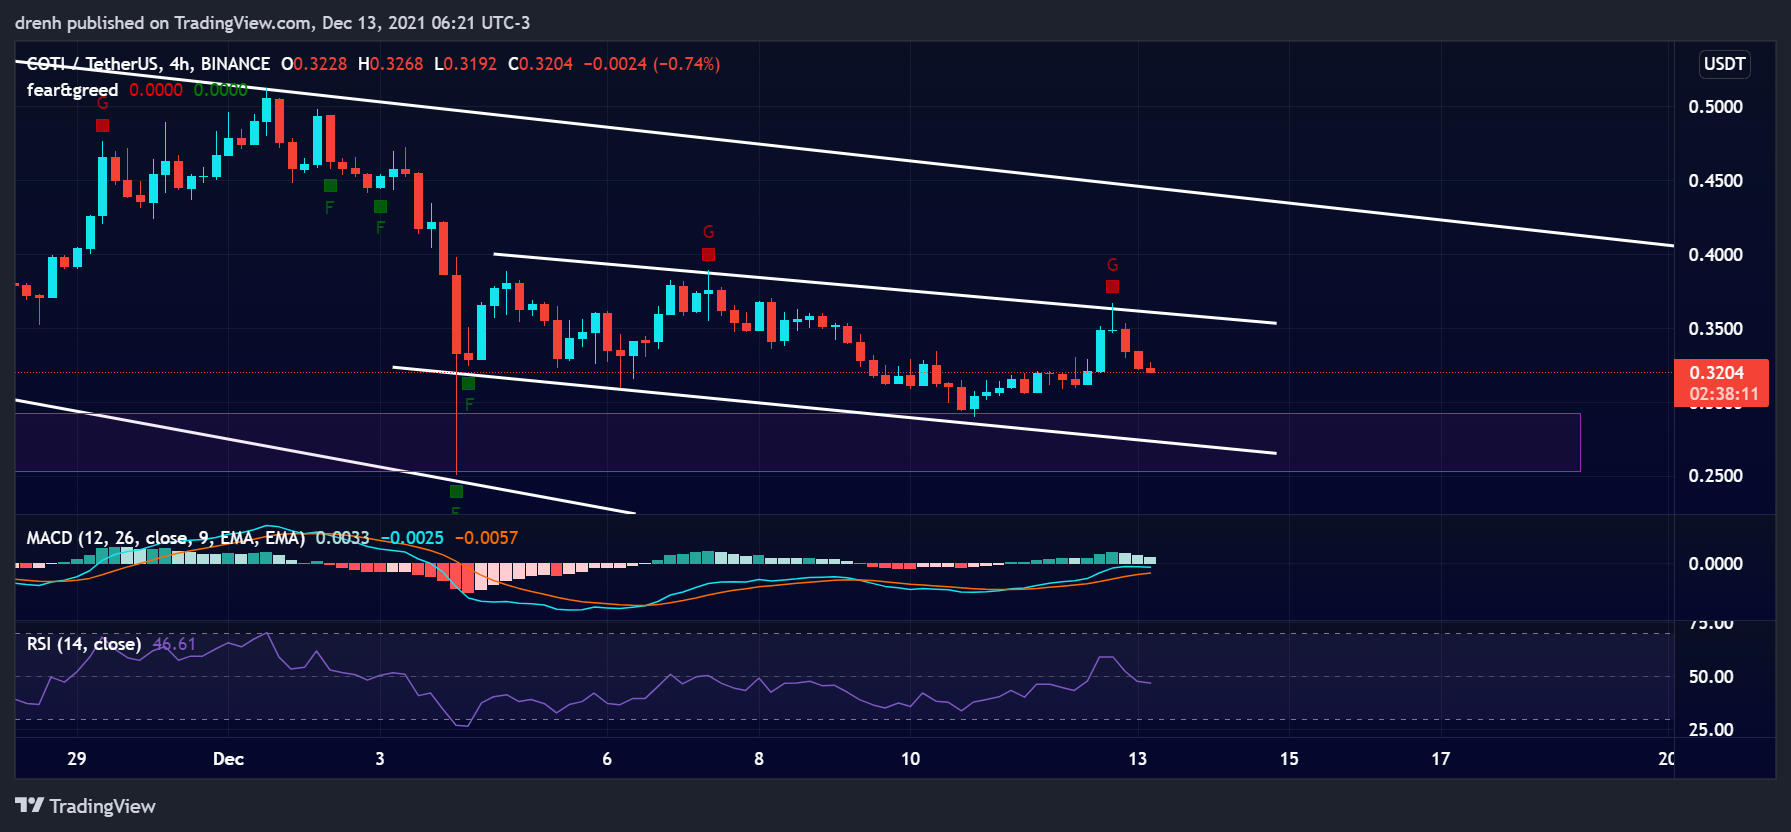
The RSI of a 4-hour chart has been declining recently, but it is still within the 3070 range. This indicates that there is room for the price of COTI to fluctuate in the short run.
MACD
The MACD line of a 4-hour chart is above the signal line, meaning that the momentum is bullish due to the recent upward movement. However, the lines have started converging, hinting at a possible shift in momentum in the short run.
Fear & Greed
The fear and greed indicator of a 4-hour chart suggests that the current emotion of COTI traders is greed due to the recent upward movement. Nonetheless, this could soon turn into fear as the price has started declining again.
Fibonacci
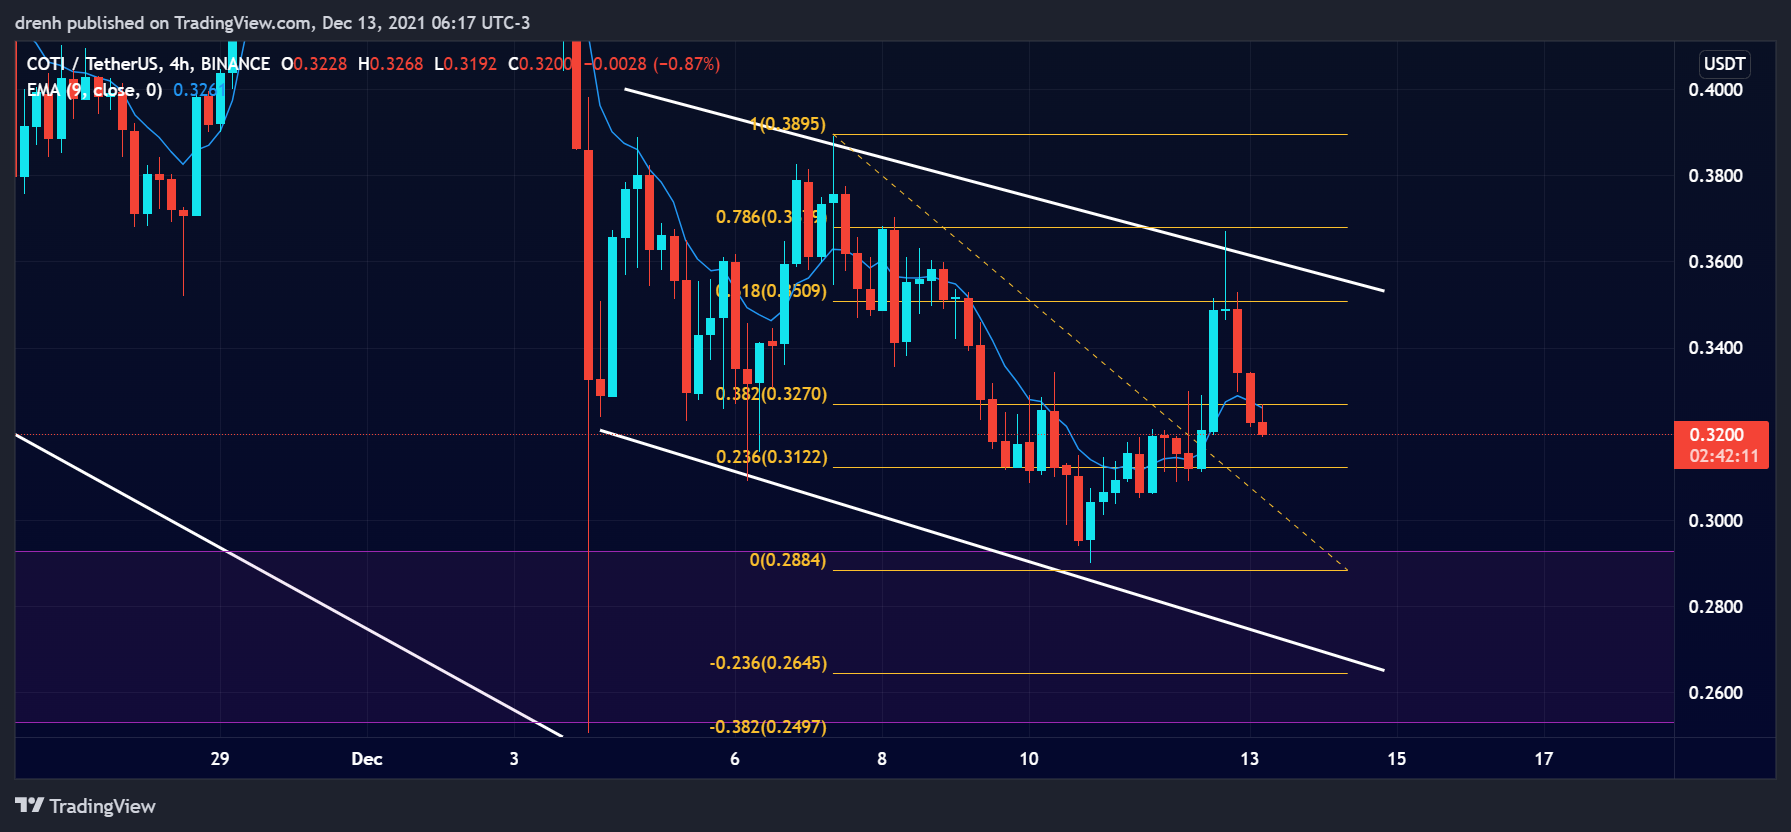
The Fibonacci retracement levels of a 4-hour chart suggest that the price of COTI has retraced to the 78.6% level. This could see the price of COTI decline below $0.30 once again in the short run.
Price Prediction COTI – December 2021
Based on this technical analysis on COTI (COTI), its price could keep declining in the coming days, close to $0.25. There, we could expect the price to find strong support and have another go upward by attempting a rebound. After that, we could see the price aim for $0.50, if the bull run intensifies once again, other things equal.
Latest News for COTI – Affecting Price
Brazil is currently working on integrating cryptocurrencies and regulating them as a financial tool. If this occurs, then we could expect another bull trend in the market. This would greatly affect the price of COTI.
Also read:
What is COTI Coin? – Everything you Need to Know About COTI
COTI Review – Is COTI a Good Investment?
Coti Price Prediction 2022 and Beyond – Can COTI Eventually Hit $1?
COTI Price Prediction 2025 – What Will COTI Price Be in 2025?
COTI Price Prediction 2030 – What Will COTI Price Be in 2030?