


LINK Technical Analysis – September 2021
Monthly Analysis
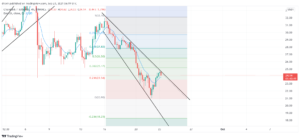
Over the last 30 days, LINK increased by about 50%. This decrease was then followed by a decrease of 34%. Then, LINK was in a period of consolidation, and it attempted to grow higher in the coming days again. Then, the price decreased by 35% once again. The price is currently pulling back.
Weekly Analysis
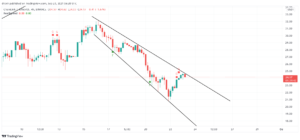
In the last 7 days, LINK decreased by 35%, and the price recently found support at $20.8. Currently, the price is pulling back, but it may fail to surpass resistance at $24.6. If the selling pressure is higher, then we might see LINK decrease in the short run.
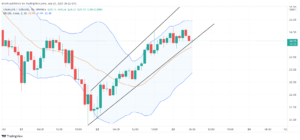
Daily Analysis
In the intraday chart, LINK was bullish, as the price found support and pulled back. Nonetheless, it encountered resistance at $24.6. While it has been bullish in the last hours, this resistance might mean that LINK can decrease in the coming hours.

Key Structures
Support
- $20.8
Resistance
- $24.6
Indicators
Moving Average
Due to the recent price dip of LINK, the 20-day moving average is now above the price. Since it is above the price, it indicates that the trend is bearish and that this MA line can act as resistance in the coming days.
The 9-day EMA is also above the price, meaning that the price can decrease even further. The EMA line can also act as support in the short run.
Relative Strength Index
The RSI of the daily chart suggests that LINK is below 50, meaning that its momentum is bearish, but at the same time, it has space to grow even further. The same can be said about the RSI of a 4-hour chart.
MACD
In the daily chart, the MACD line is below the signal line and below the baseline. This suggests that the momentum is bearish and that the price might keep decreasing. However, in a 4-hour chart, the MACD line has gotten above the signal line, meaning that the shorter term is bullish.
Fear & Greed
The fear and greed indicator in a 4-hour chart suggests that the current emotion in LINK traders is greed, primarily due to the recent pullback.

Fibonacci
The Fibonacci retracement level of the previous bearish breakout suggests that the price of LINK encountered resistance at the 50% level twice. Nonetheless, the price increased after that. Then, the price went to the anticipated Fibonacci extension of 23.6% level.
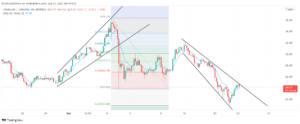

As for the recent downtrend, the price of LINK has space to retrace to one of the Fibonacci levels in the coming days. If that occurs, LINK might go to one of the extension levels.

Price Prediction LINK – September 2021
Based on this technical analysis on LINK, its price could decrease in the coming hours or days since it is in a downtrend. If resistance at $24.6 – $25 is strong enough, we could see LINK go close to $19 in the coming days.
Latest News for LINK – Affecting Price
AutoShark is planning to use Chainlink’s ecosystem to further enhance its NFT engagement. Since NFTs are one of the biggest assets of 2021, this can have a huge boost to the price of LINK.
Also read: Chainlink Price Prediction 2021 and Beyond – Is LINK a Good Investment?