


LINK Technical Analysis – November 2021
Monthly Analysis
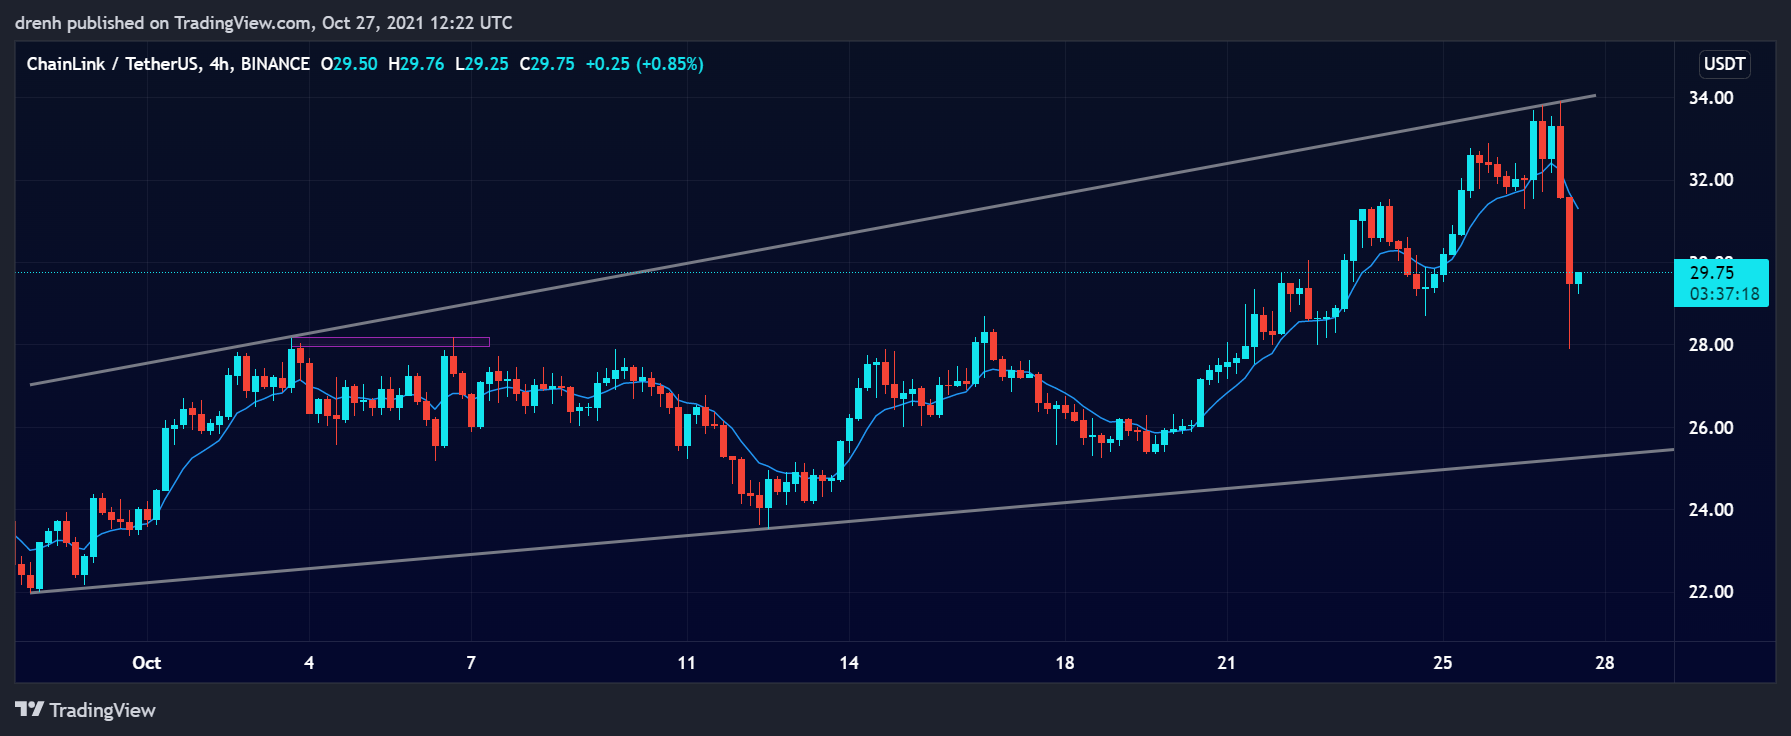
In the last 30 days, LINK has increased by around 54%. The trend is upward, indicating that the price of LINK can keep increasing in the coming days. However, a recent bearish breakout may suggest that the trend can reverse.

Weekly Analysis
In the last 7 days, LINK has increased by around 20%. Despite being bullish in the last few days, LINK has recently had a bearish breakout of around 17%. It has found support at around $28, and the price is now in correction.
Daily Analysis
In the intraday chart, LINK has been bearish. The trend is downward, meaning that its price can further decline in the coming hours. The price of LINK in the intraday chart is in consolidation.
Key Structures
Support
- $27.90
Resistance
- $33.80
Indicators
Moving Average
After being below the price for a while, the 20-day moving average is now above the price, indicating that the trend is reversing and that the price of LINK may decrease in the coming days.
The 9-day EMA is now also above the price, meaning that the price of LINk may decline in the short run and that the EMA line can act as resistance if LINK attempts to correct.
Relative Strength Index
The RSI is now moving down after recently being close to the overbought region. This suggests that sellers have taken over for LINK. Similar can be said about the 4-hour chart, which is slightly more bearish.
MACD
The MACD line of a 1-day chart is above the signal line, meaning that the momentum is bullish for LINK, despite the recent dip in the price. However, the MACD line is quite below the signal line in a 4-hour chart, indicating that the momentum is bearish for the shorter term.
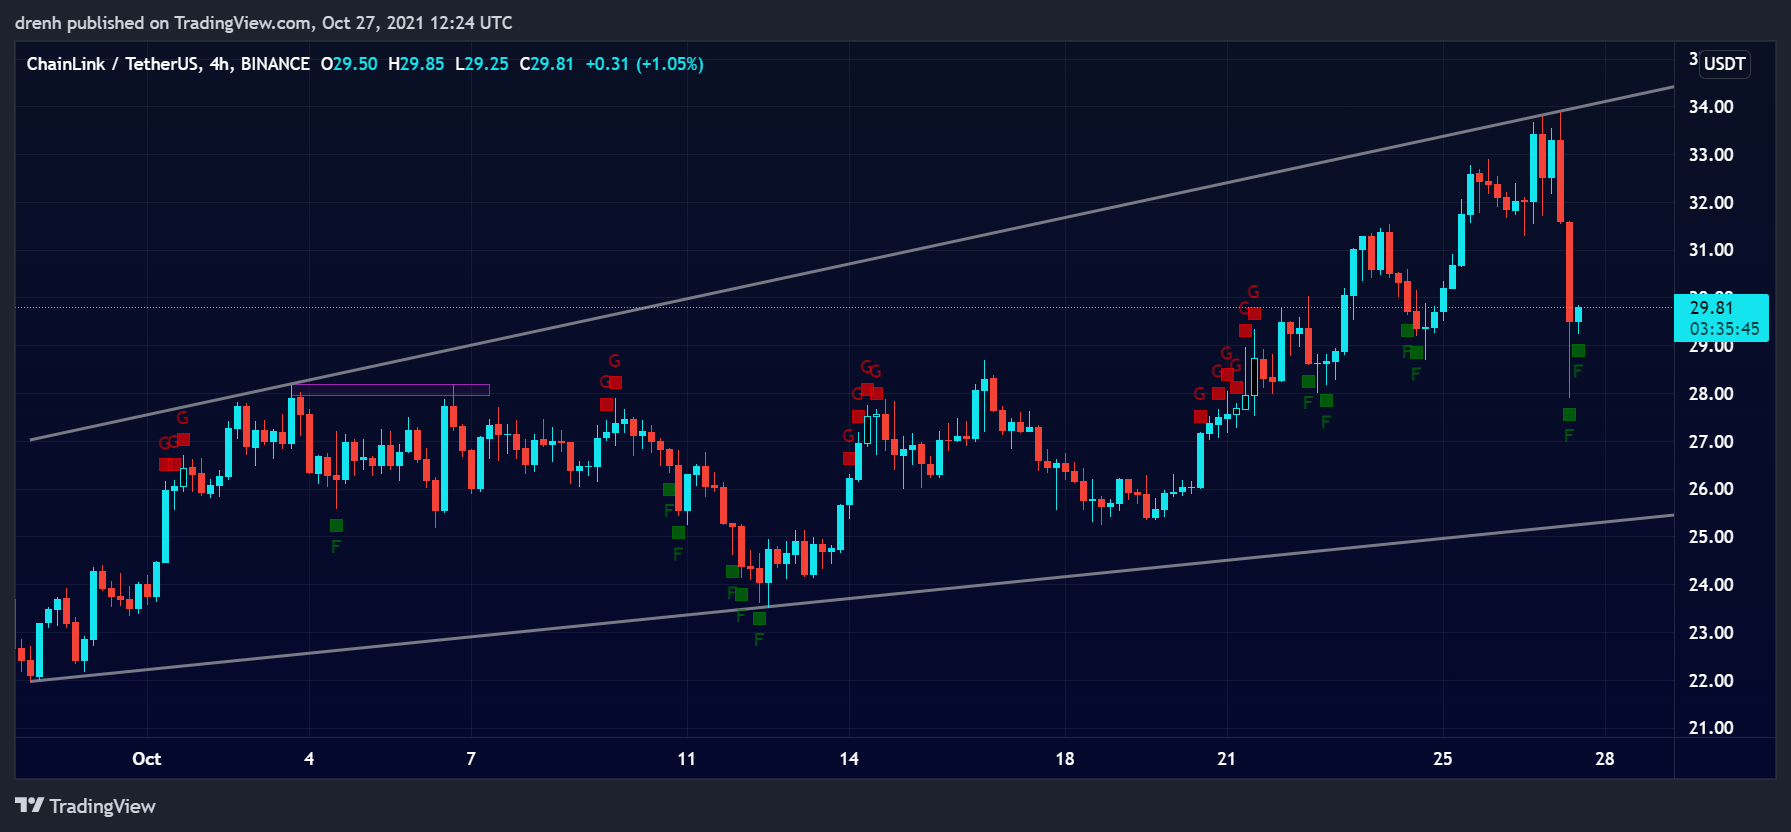
Fear & Greed
The fear and greed indicator of a 4-hour chart suggests that the current emotion of LINK traders is fear due to the recent dip in the price.

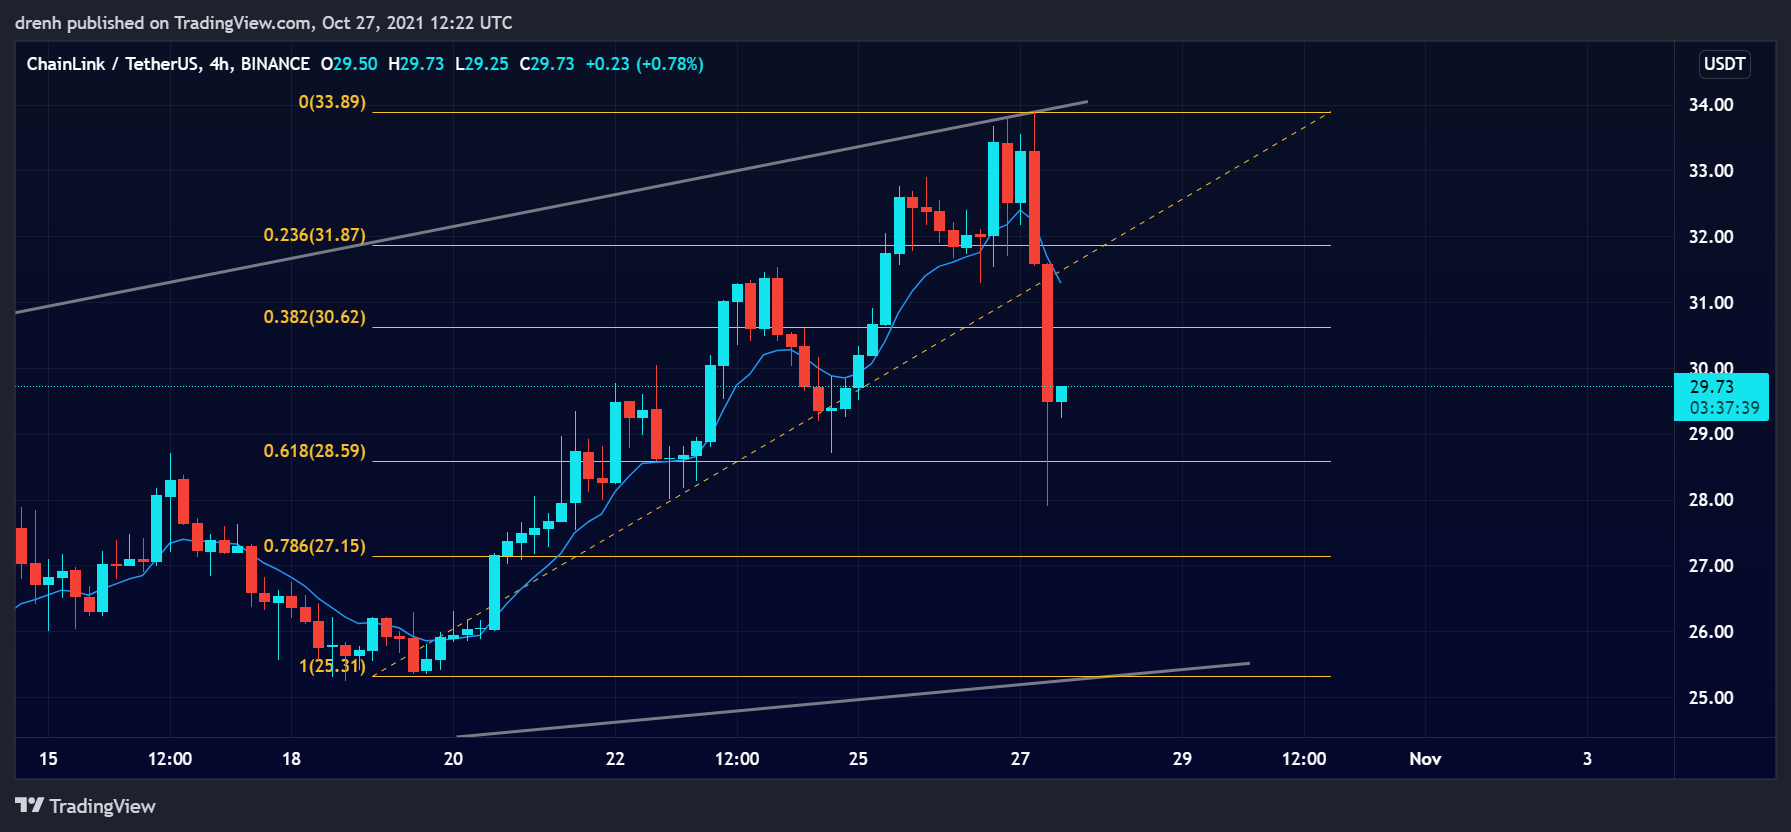
Fibonacci
The Fibonacci retracement levels suggest that the price of LINK has penetrated support at 61.8%. Because of that, we could expect a higher buying pressure at the 78.6% level.
Price Prediction LINK – November 2021
Based on this technical analysis on Chainlink (LINK) we could see its price decline in the coming days at around $27. If it finds support there, LINK may have another surge upwards and retest resistance at $33.80. Furthermore, if BTC keeps increasing in this bull cycle, cryptocurrencies such as Chainlink may follow as well. The latter has the potential to reach a new all-time high in the coming weeks and perhaps even aim for $100.
Latest News for LINK – Affecting Price
CODI Finance is looking to integrate itself into the Chainlink network. The former is gaining more attention every day as it has various distinct DeFi features. This can have a positive effect on the price of Chainlink in the coming days.
Also read: Chainlink Price Prediction 2021 and Beyond – Is LINK a Good Investment?