


ADA Technical Analysis – December 2021
Monthly Analysis
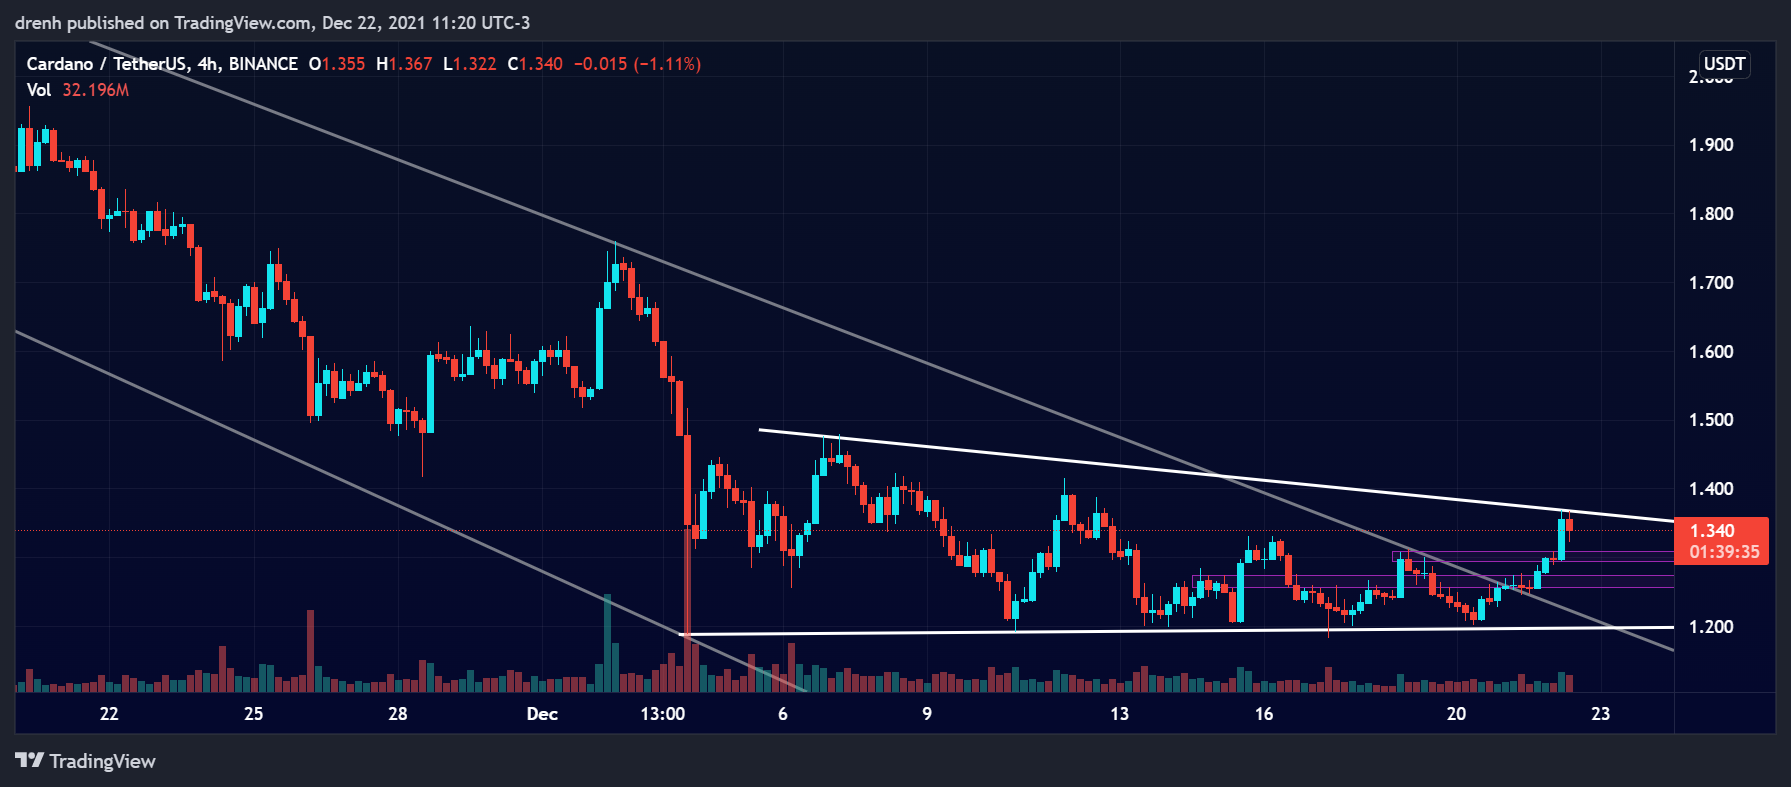
In the last 30 days, ADA has been bearish. The price declined by around 40%, where it then found support close to $1.20. After that, the price has been in a phase of consolidation. In the recent price movement, the descending triangle pattern that was formed had indicated a possible breakout, which has occurred recently. This could lead to a trend reversal for ADA.

Weekly Analysis
In the last 7 days, the price of ADA has fluctuated by 10% continually. This phase of consolidation was recently broken, as the price increased by an additional 14%. The price is currently facing resistance at $1.37. ADA is still bearish nonetheless, but the recent high is higher than the previous, hinting at a potential trend reversal.
Daily Analysis
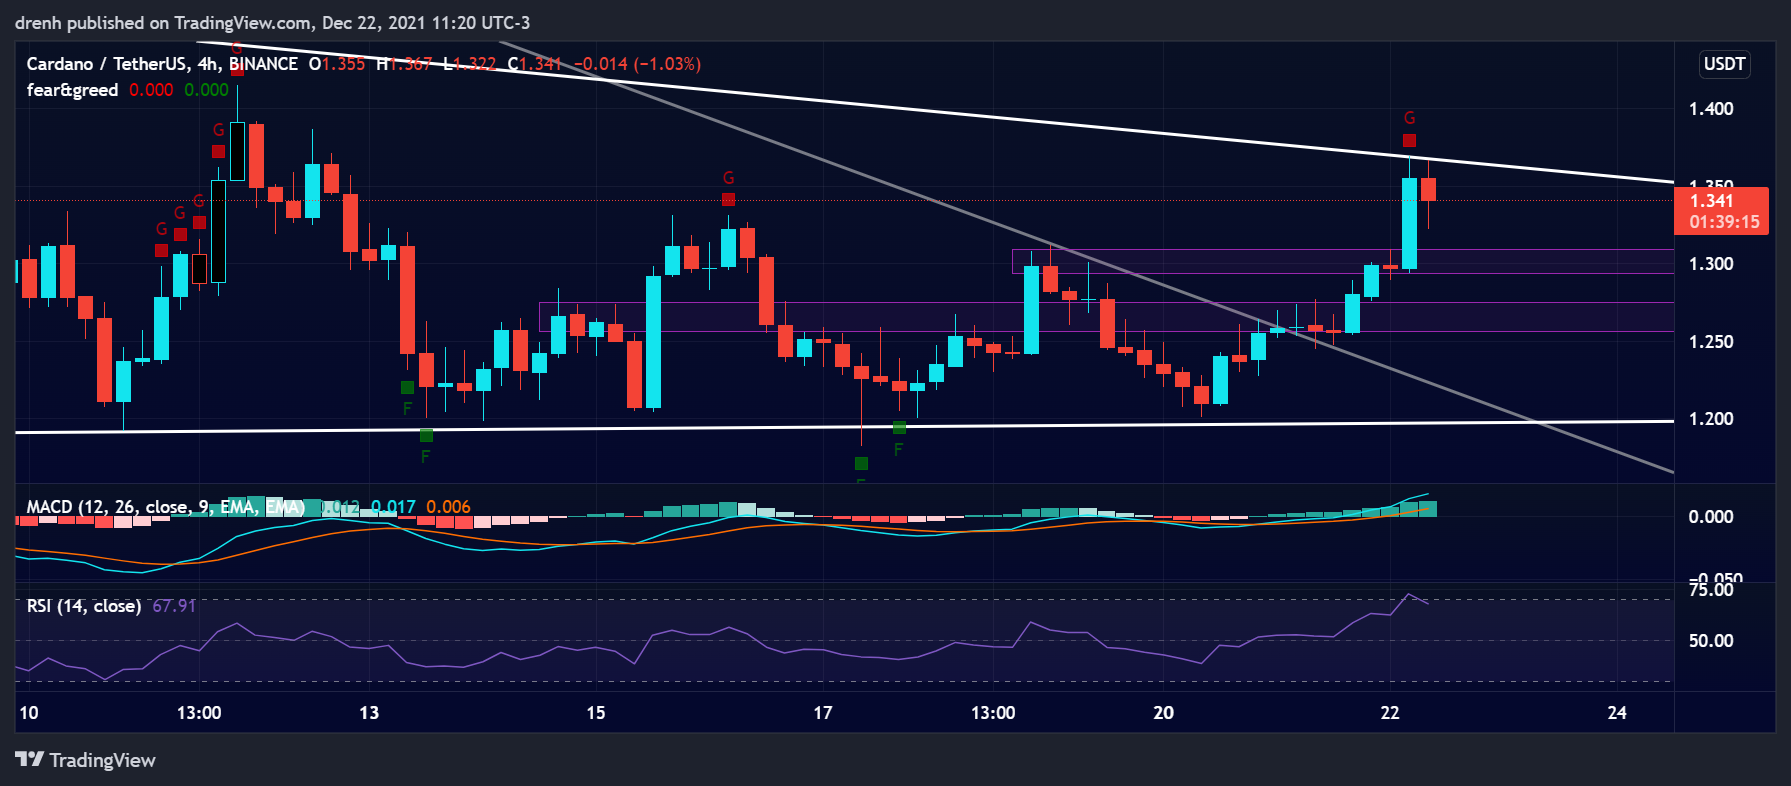
In the intraday chart, ADA has been highly volatile. The price has increased by 10% in the last 24 hours alone, suggesting that ADA was bullish in the intraday chart. We could soon expect ADA to hit resistance and retrace a little in order to continue its journey upward.
Key Structures
Support
- $1.20
Resistance
- $1.40
Indicators
Moving Average
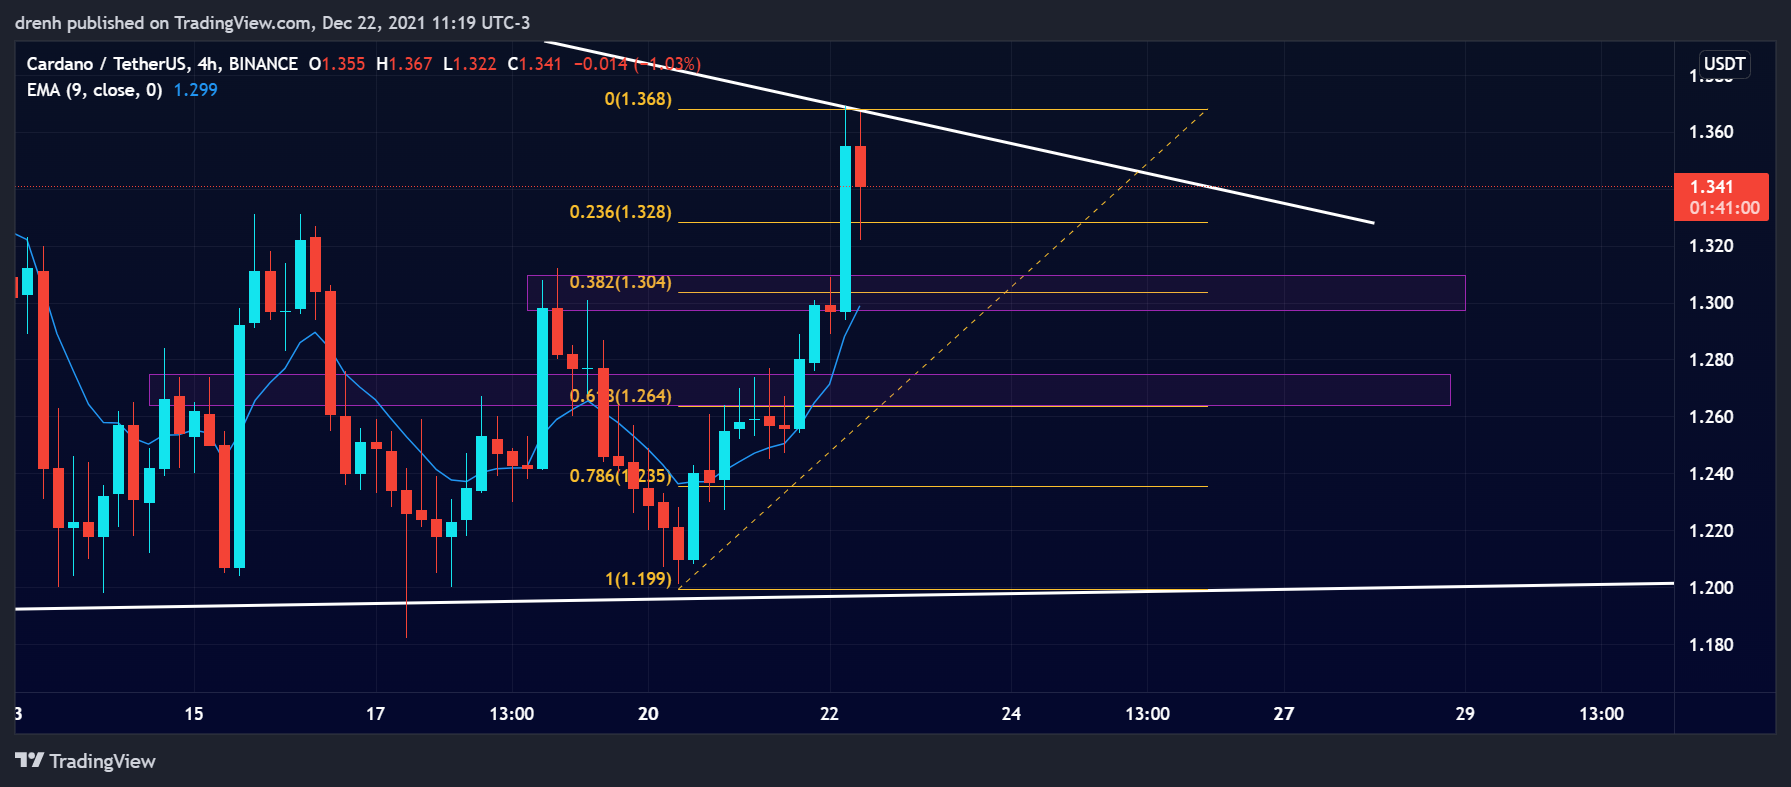
The 20-MA line of a 4-hour chart is currently below the price due to the recent upward movement of the price, indicating that the trend may now face upward and that the price of ADA could potentially increase in the coming days.
The 9-EMA of a 4-hour chart is also currently below the price, indicating that the price of ADA might be bullish in the short run and that the EMA line could act as a support structure if the price retraces.
Relative Strength Index
The RSI of a 4-hour chart has recently climbed above 70, meaning that ADA has become overbought. This could see the price of ADA retrace in the short run until the RSI is back within the 30-70 range again.
MACD
The MACD line of a 4-hour chart is quite above the signal line and above the baseline. This indicates that the momentum or ADA is currently bullish and that the price could keep increasing in the short run.
Fear & Greed
The fear and greed indicator of a 4-hour chart suggests that the current emotion of ADA traders is greed, indicating that investors are bullish for the short run and that the price could potentially increase.

Fibonacci
The Fibonacci retracement levels of a 4-hour chart suggest that if the price retraces in the short run as expected, then it could find support at either the 38.2% or the 61.8% level as they both could prove to be strong due to the alignment with previous structures as well.
Price Prediction ADA – December 2021
Based on this technical analysis on Cardano (ADA), the price of ADA could retrace in the short run. However, we could see ADA find support at around $1.27. After that, the price could continue its journey upward as ADA is aiming to rebound from its recent downfall and perhaps change its trend. The price could go close to $1.50 in the coming days. Eventually, we could see ADA hit $2 once again, other things equal.
Latest News for ADA – Affecting Price
Charles Hoskinson, the founder of Cardano, recently stated that Cardano’s future is one of the brightest in the market, as the ADA token could potentially be of use by billions of people around the world.
Also read:
Charles Hoskinson Unravels Proxy Keys as Cardano (ADA) Passes 20M Transactions
Cardano ($ADA) Backed DeFi Platform Will Release Gold-Backed Stablecoin