

- SOLANA soars to the level it has not attain for the past six months
- Bullish movement interrupts at $68 level
- Bulls may resume to the market after the pullback
The bulls may continue to dominate the market as long as the price break up $68 resistance level and the price will face the resistance levels of $74 and $80. Inability to break up the $68 level may return the price to support levels at $62, $55, and $49.
SOL/USD Market
Key levels:
Resistance levels: $68, $74, $80
Support levels: $62, $55, $49

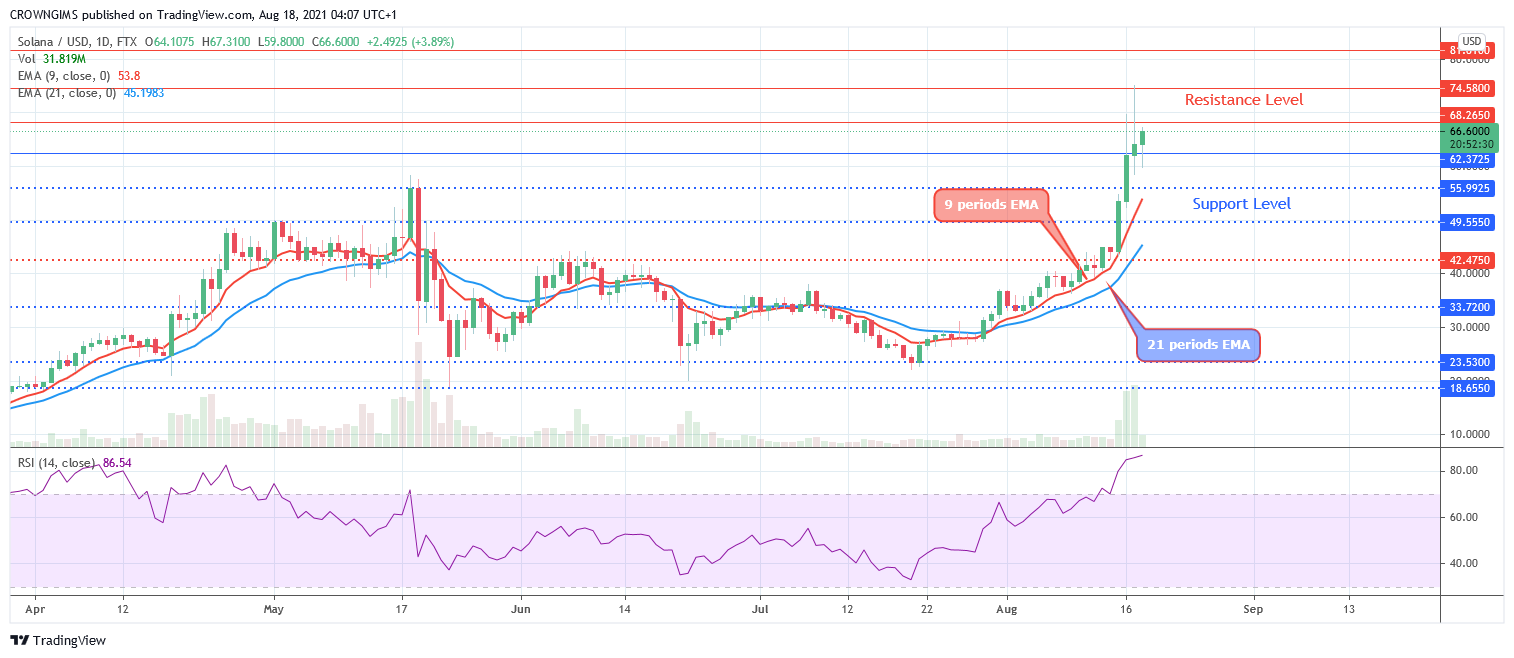
SOLUSD Long-term Trend: Bullish
SOLUSD is bullish on the daily chart. The bulls obey the effect of the triple bottom chart pattern formed at the support level of $23. This is what triggers the soaring of the coin towards the north like an eagle. The former resistance levels of $49, $55, and $62 was broken upside and the price reached the high of $68 resistance level. It pulls back to retest the broken level of $62.
The buyers are returning in to the SOLANA market after the pullback. The fast Moving Average (9 periods) has crossed the slow Moving Average (21 periods EMA) upside and the price is trading above the two EMAs which indicates a bullish trend. The bulls may continue to dominate the market as long as the price break up the $68 resistance level and the price will face the resistance levels of $74 and $80. Inability to break up the $68 level may return the price to support levels at $62, $55, and $49.

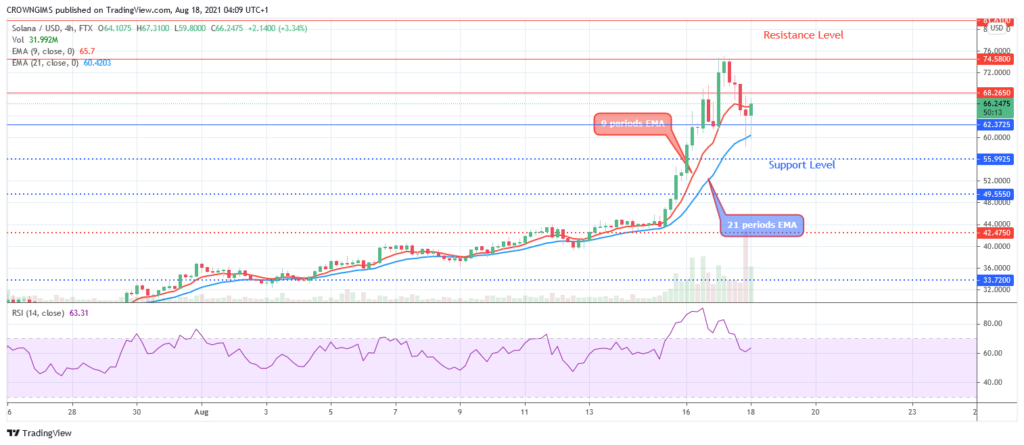
SOLUSD medium-term Trend: Bullish
SOLUSD is bullish in the 4-hour chart. Bullish trend continues in the medium term trend as the bulls are steadily gaining more pressure. The resistance level of $74 is tested after broken up resistance levels such as $55, $62 and $68. The $74 level holds and the price is carrying out a retracement towards the broken levels.
The two EMAs are separated from each other as an indication of high momentum market. The currency pair is trading between the 9 periods EMA and 21 periods EMA which indicates pullback. The relative strength index period 14 is at 60 levels and the signal lines bending up to indicate buy signal.
Also read: 14- and 9-Year-Old Ethereum Miners Earn up to 32k Monthly
Note: Crypto-academy.org is not a financial advisor. Do your research before investing your funds in any financial asset or presented product or event. We are not responsible for your investing results.